

Amazon Stock Slips Below Key Averages as Traders Watch $242 Support

Amazon stock faces genuine selling pressure heading into mid-June 2026, trading below key moving averages and signaling near-term weakness. However, the longer-term structural outlook remains intact, suggesting the current phase is corrective rather than a fundamental breakdown.
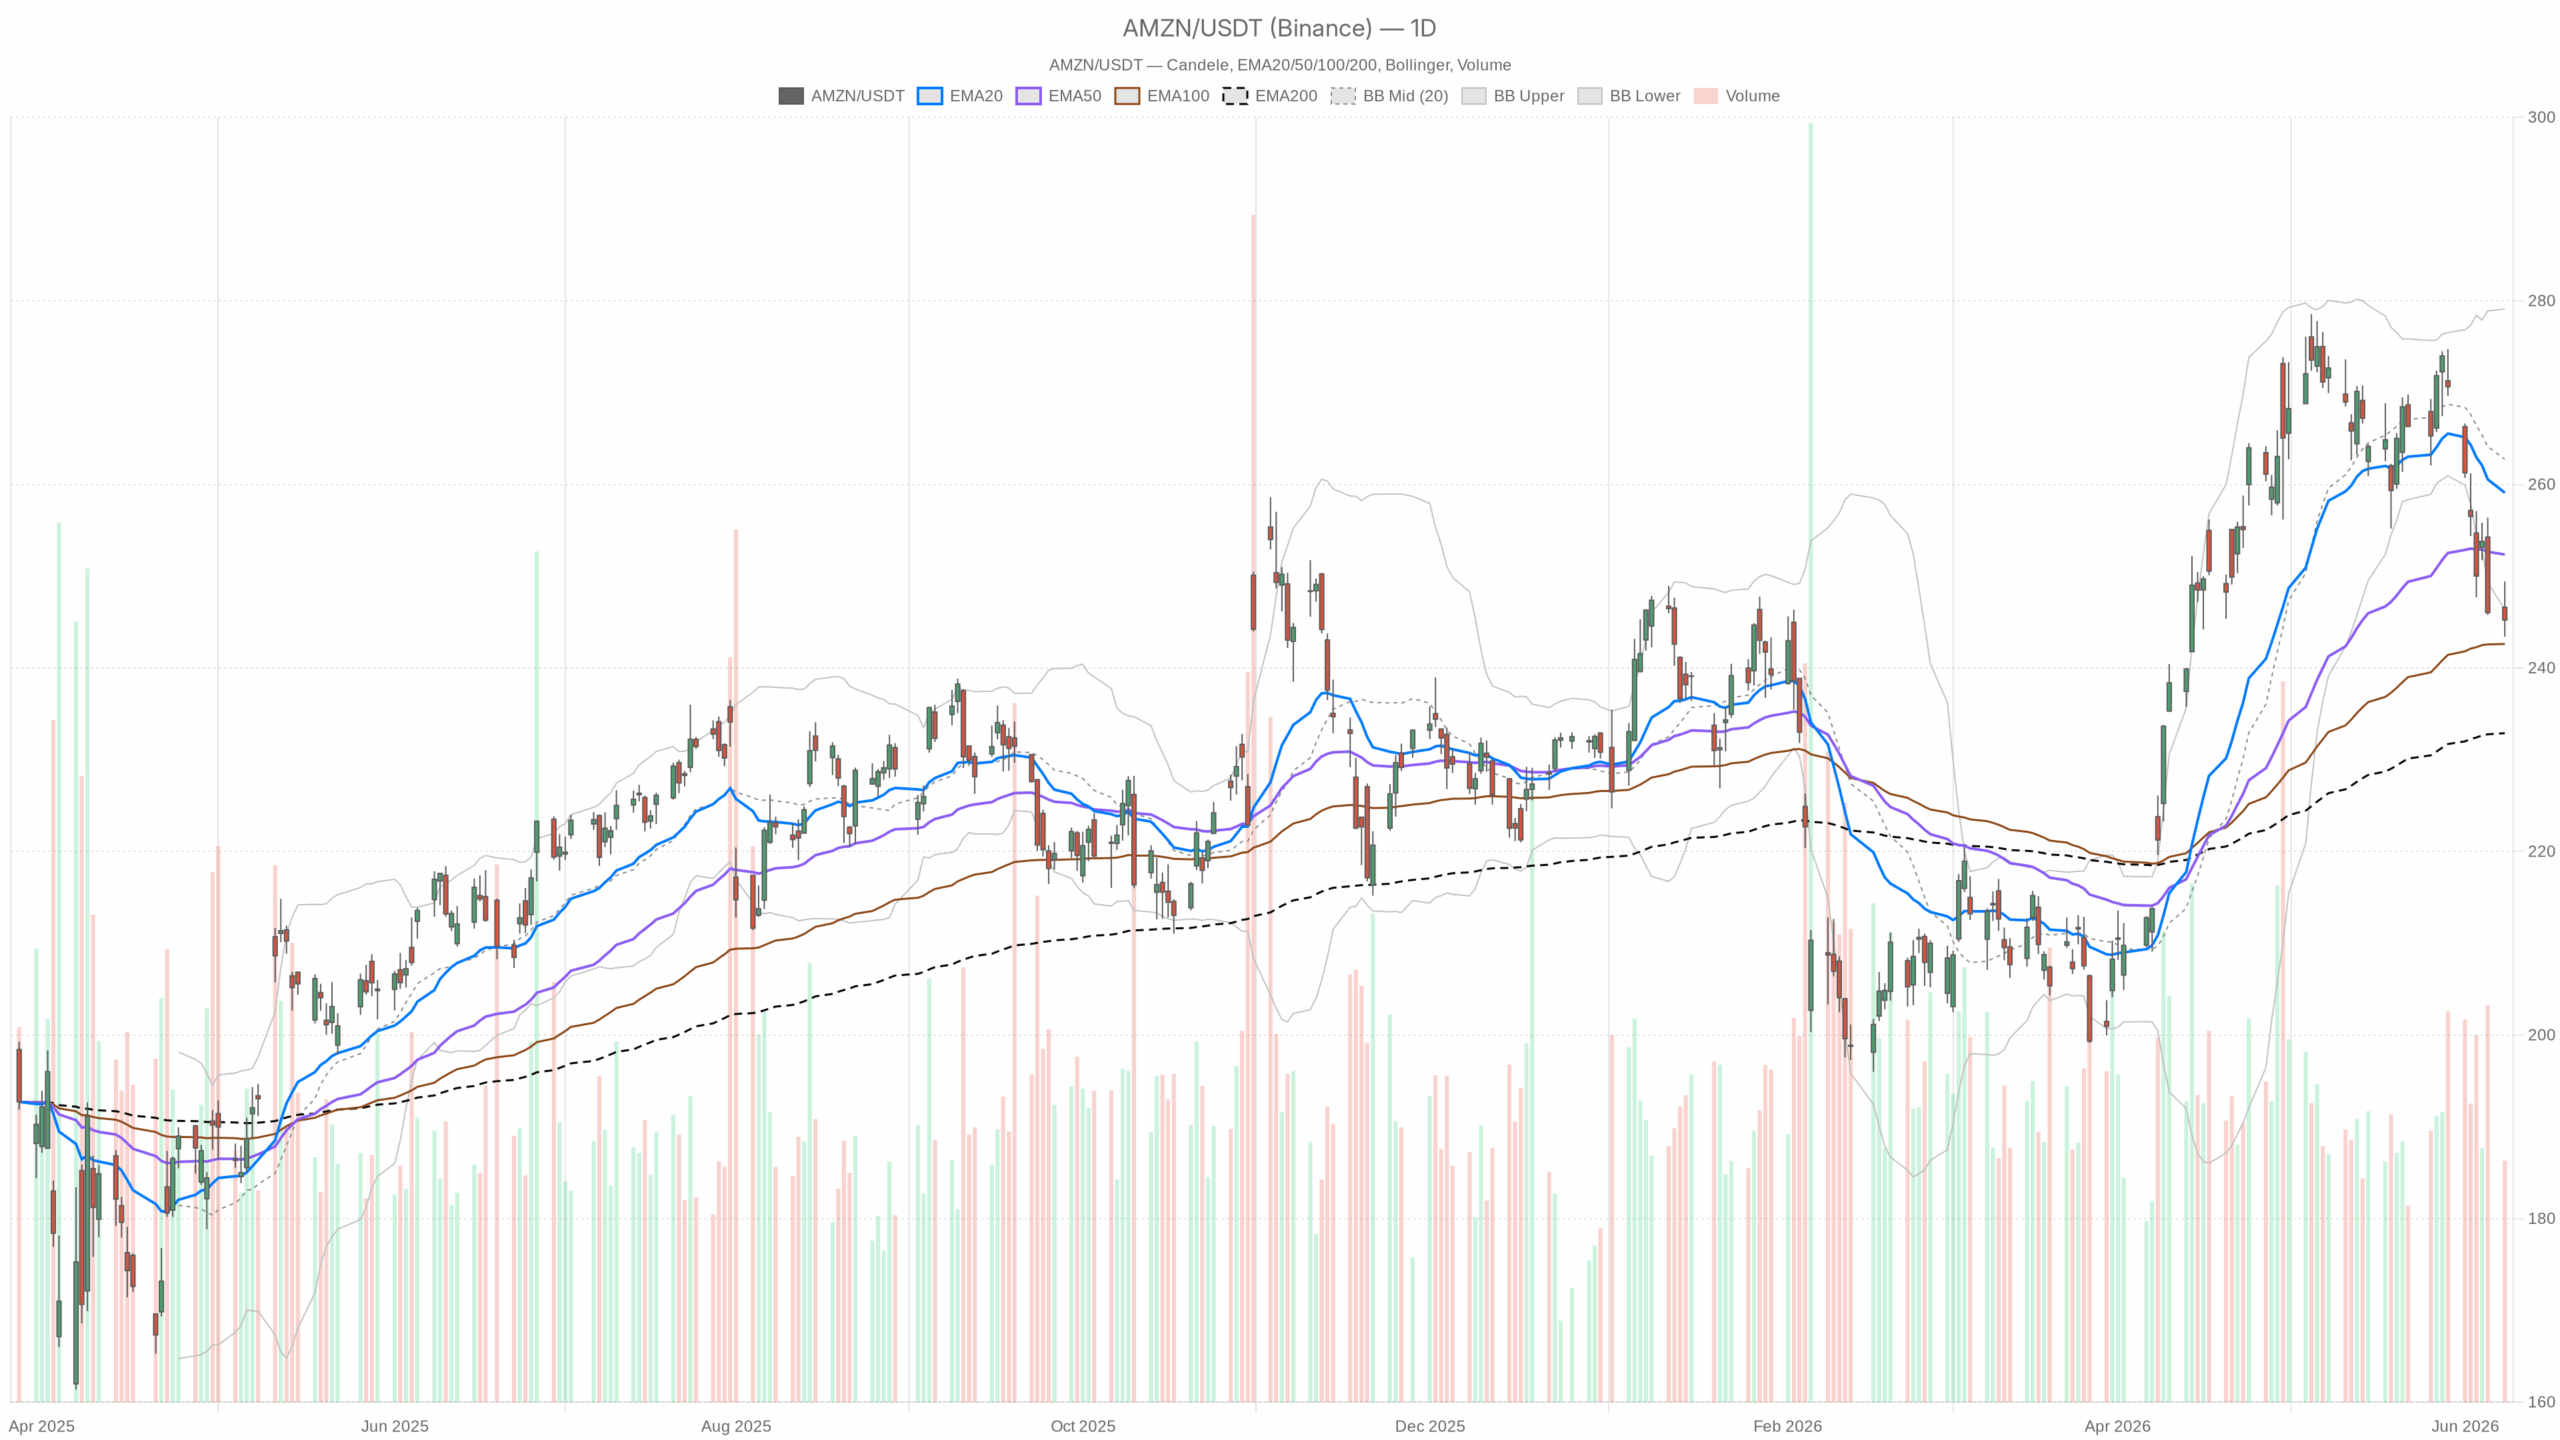 AMZN — daily chart with candlesticks, EMA20/EMA50 and volume.
Near-Term Momentum and Technical Indicators for Amazon Stock
At $245.22 on June 8th, Amazon stock closed below its 20-day EMA ($259.09) and 50-day EMA ($252.37), confirming a rollover in momentum after earlier strength this year. Yet the price holds well above the 200-day EMA at $232.90, which acts as a significant structural support. This $12–13 cushion implies the ongoing correction is likely a temporary pullback rather than the start of a sustained decline.
Key Oscillators Suggest Selling Exhaustion Is Near
The daily RSI reading of 37.27 approaches oversold territory but remains above the critical 30 level. Historically, this zone signals weakening selling momentum, indicating that aggressive short positions may soon lose strength. Meanwhile, the daily MACD remains bearish with a line at -1.51 and histogram at -3.67, reflecting accelerating negative momentum.
Interestingly, the divergence between the flattening RSI and the deeply negative MACD histogram reveals a tension worth monitoring for potential stabilization.
Volatility and Price Bands Paint an Ambiguous Picture
Bollinger Bands place the daily mid-band at $262.75 and the lower band at $246.38, with the most recent close marginally below the lower band at $245.22. Such a close often suggests either a mean-reversion bounce or the early stages of a breakdown. Given the neutral daily regime, a bounce back appears more probable at this stage. The average true range (ATR) of $7.34 confirms elevated daily volatility, underscoring the need for cautious position sizing.
Intraday Technical Structure and Short-Term Bearish Pressure
On the hourly chart, the bearish narrative intensifies. The price trades below all major EMAs: EMA20 ($249.06), EMA50 ($254.51), and EMA200 ($258.89), confirming active corrective pressure. The hourly RSI of 30.24 hovers near oversold levels, creating tension as bearish momentum shows signs of exhaustion on this shorter timeframe.
Hourly MACD and Support Zones
The hourly MACD delivers a near-zero histogram (-0.19), indicating that despite negative momentum, bearish pressure may be stabilizing intraday. The hourly ATR at $2.30 reflects moderate volatility, while the lower Bollinger Band at $242.00 aligns closely with the daily S1 support at $242.60 — a critical level that could determine whether the correction deepens or stabilizes further.
Micro-Timeframe Insights: 15-Minute Chart Analysis
The 15-minute chart reveals a slightly less bearish momentum. Price trades below the EMA50 ($247.81) and EMA200 ($255.24), yet the MACD histogram has turned positive (+0.21) and RSI sits at a neutral 41.74. These indicators suggest very short-term stabilization, though not a reversal. The $244.87–$245.58 range, defined by the 15-minute pivot support and resistance, forms the immediate battleground for price action.
Fundamental Backdrop Supporting Amazon Stock’s Longer-Term Outlook
Amazon’s strategic announcements remain constructive despite near-term volatility. The multibillion-dollar deal with Corning to supply optical fiber underscores growth in AWS infrastructure, a key margin driver. Additionally, the launch of the Proteus autonomous robot as part of a €10 billion European modernization supports long-term operational efficiency.
Amazon’s acquisition of Apple’s 20% stake in Globalstar within the $11.6 billion deal highlights ongoing diversification. Institutional investor confidence remains robust, with 353 hedge funds holding positions and prominent backing from managers like Ken Fisher and Tiger Global.
Scenarios for Amazon Stock’s Next Moves
Bullish Case Conditions
- Price must reclaim and maintain above the $246 daily pivot on a close basis.
- Hourly RSI should recover from near oversold without dipping below 30 sustainably.
- Daily MACD histogram needs to shrink toward zero, signaling bearish momentum easing.
If these align, a recovery toward the EMA50 at $252.37 would be probable, with $259 representing the next resistance at EMA20. The strong fundamental backdrop adds credibility to this medium-term rebound thesis.
Bearish Case Conditions
A clear bearish trigger would be a daily close beneath the $242.60 S1 support, invalidating the current neutral daily regime. Such a break could accelerate selling toward the $232–$234 zone, where the 200-day EMA offers key structural support.
On intraday charts, breaking below the $242 hourly lower Bollinger Band would confirm an extended corrective move. Given the deeply negative daily MACD and the current price below key bands, bears hold the advantage until proven otherwise.
Conclusion: Amazon Stock at a Crucial Technical Juncture
The near-term outlook for Amazon stock remains fragile, with daily and hourly charts signaling continued weakness. However, the longer-term structure remains intact above the 200-day EMA, supporting a corrective narrative rather than a breakdown.
The faint stabilization on the 15-minute timeframe is insufficient to shift the overall bearish tone. Elevated volatility calls for disciplined risk management. Key technical levels to watch are $246 on the upside and $242.60 on the downside. Until price confirms a move above the daily pivot with positive momentum, traders should respect the prevailing short-term bearish trend while monitoring support near $232.90 for the longer-term outlook.


You May Also Like

Is Micron (MU) Stock a Buy Before Its Massive Earnings Report on June 24?

Deaths rise to 37 after 7.8-magnitude Mindanao quake; retrieval ops continue — OCD

Fragmented Ledgers and Connected Value: Interoperability Over Uniformity


