

Canton (CC) Price Prediction: Analyst Sees Breakout as Charts Confirm Setup
Key highlights:
- CC price is compressing inside a tight wedge after months of sideways trading between key support and resistance.
- Key levels are $0.175–$0.18 resistance and $0.138–$0.14 support, defining the breakout direction.
- Grayscale’s ETF filing and DTCC’s tokenization pilot could drive the next move.
Canton has spent the past few months doing something that often frustrates traders the most: moving sideways. After climbing from the December 2025 lows near $0.07–$0.08 to almost $0.27 in February, Canton entered a long consolidation phase that has kept buyers and sellers locked in a battle.
Now that the range is getting tighter, and many traders believe a decisive move is getting close. Crypto analyst Don summed up that view in a simple post, saying the CC price is "about to pump."
The charts show why that idea is attracting attention. Price continues to defend major support, momentum remains healthy, and several institutional developments could give the market an additional reason to move.
The Canton chart could be getting ready for a big move
Crypto analyst Don’s chart gives his idea some support. After bouncing from the December lows around $0.07–$0.08 and climbing to nearly $0.27 in February, CC has spent the past few months moving inside a tightening triangle, with buyers and sellers gradually squeezing the price into a smaller range.
The first level everyone is watching is $0.23–$0.235. If the CC price can close above that area, it would break out of months of sideways trading and could open the door for a move toward $0.28–$0.32, which lines up with the size of the previous rally.
At the same time, buyers have continued defending the $0.15–$0.155 zone every time the price drops into it. That support has held several times, making it one of the most important levels on the chart. If it finally gives way, the bullish setup loses strength and the CC price could slide toward $0.12.
Another thing worth noting is that trading activity has cooled during this consolidation period. That's often what happens before volatility returns. With the CC price squeezed between rising support and falling resistance, the next breakout could set the tone for the weeks ahead.
The CC price is approaching a breakout zone
We had a look at both the 4-hour and daily CC charts, and the setup is becoming difficult to ignore. The CC price is trading around $0.163, with both timeframes showing almost identical levels at $0.1634–$0.1637.
More importantly, price remains above the 100-period moving average, which sits near $0.157 on the 4-hour chart and roughly $0.151 on the daily chart. That keeps the broader structure leaning in favor of buyers.
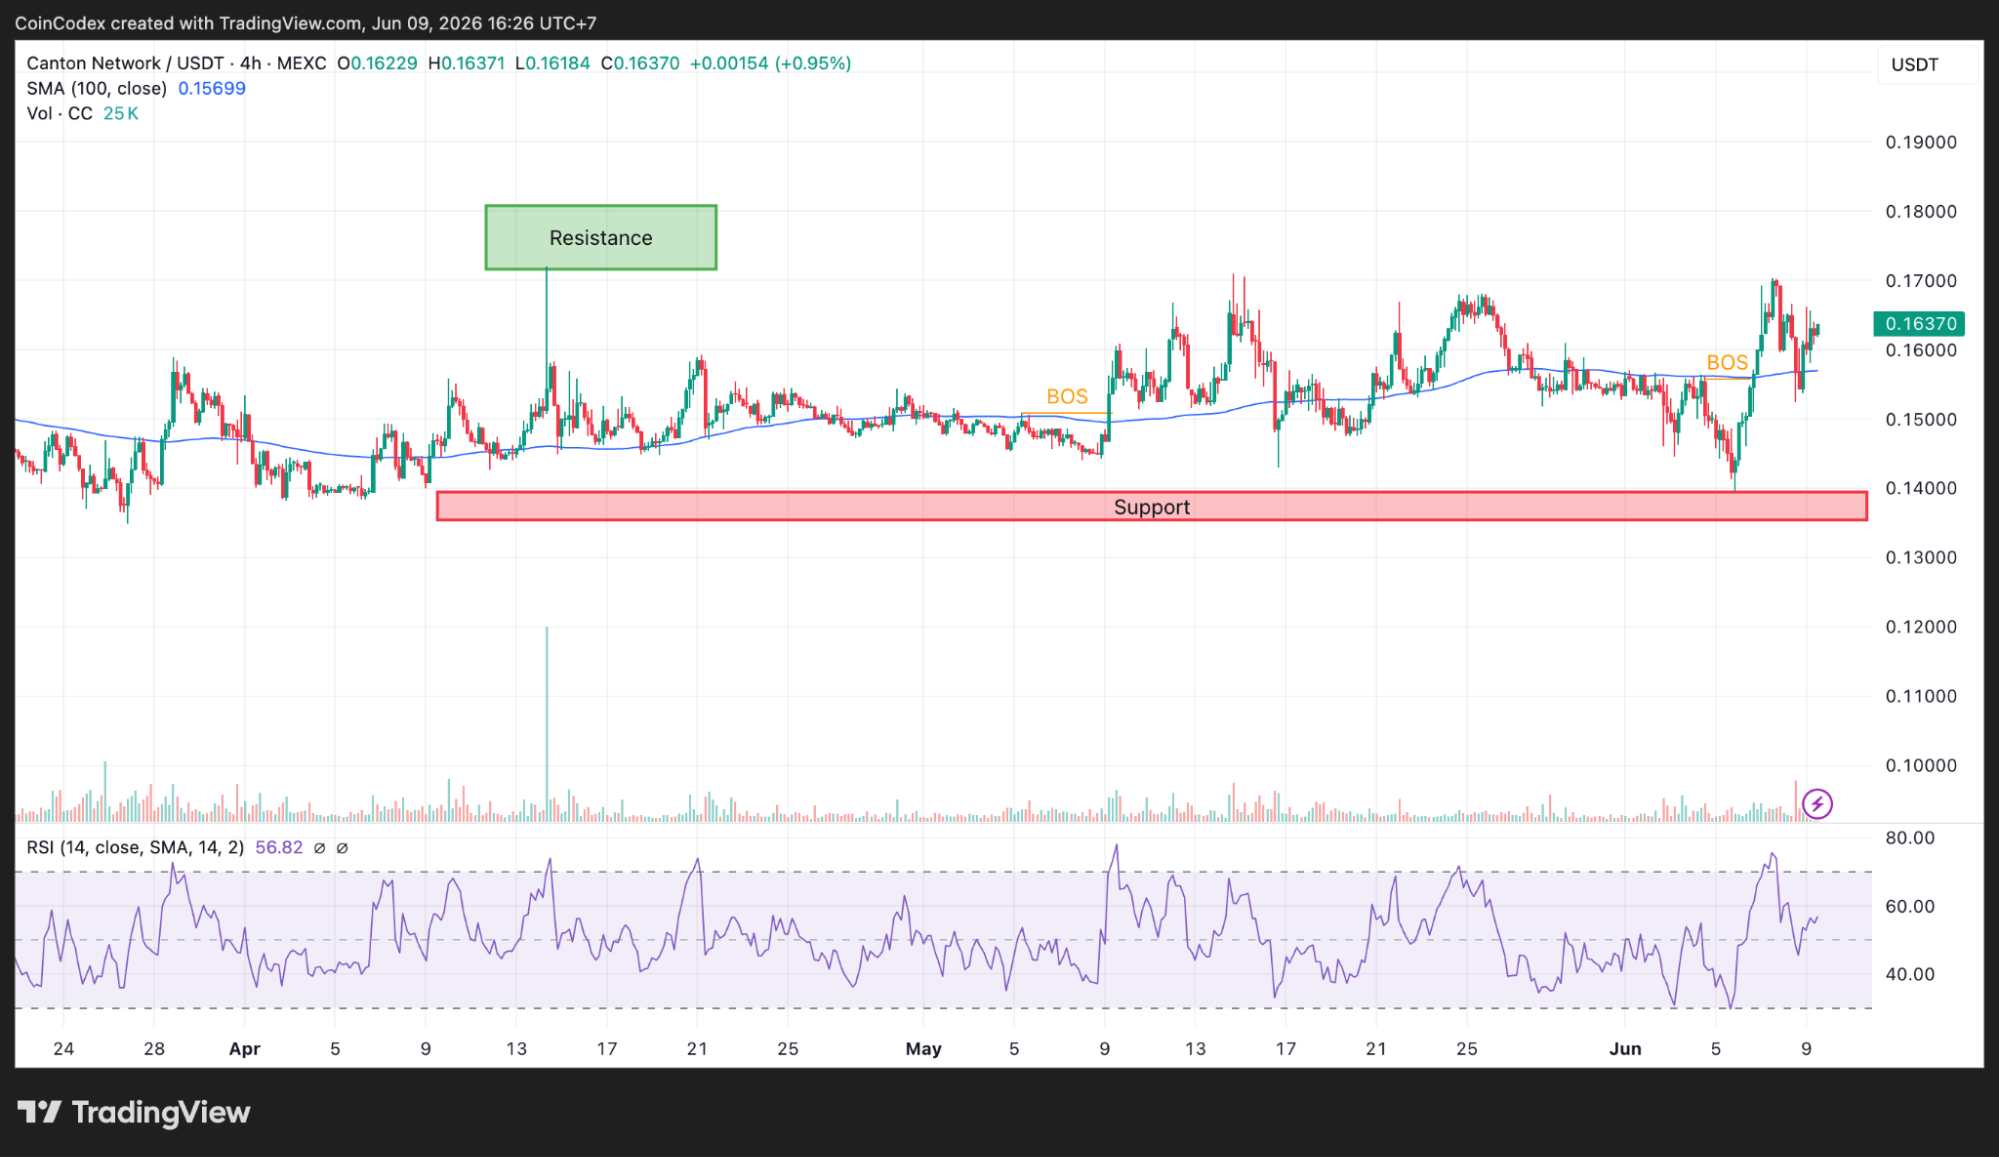
4-hour CC chart analysis. Source: TradingView
The bigger pattern tells an even more interesting story. Since reaching approximately $0.27 in February, every rally has been capped by a descending resistance line. At the same time, buyers have repeatedly stepped in around the $0.138–$0.14 support zone. Those two levels have created a large wedge that continues to tighten, leaving less and less room for sideways movement.
The daily Fibonacci levels also place the CC price at an important technical area. Price is trading near the 1.272 extension around $0.163, a level that often acts as a decision point before larger moves.
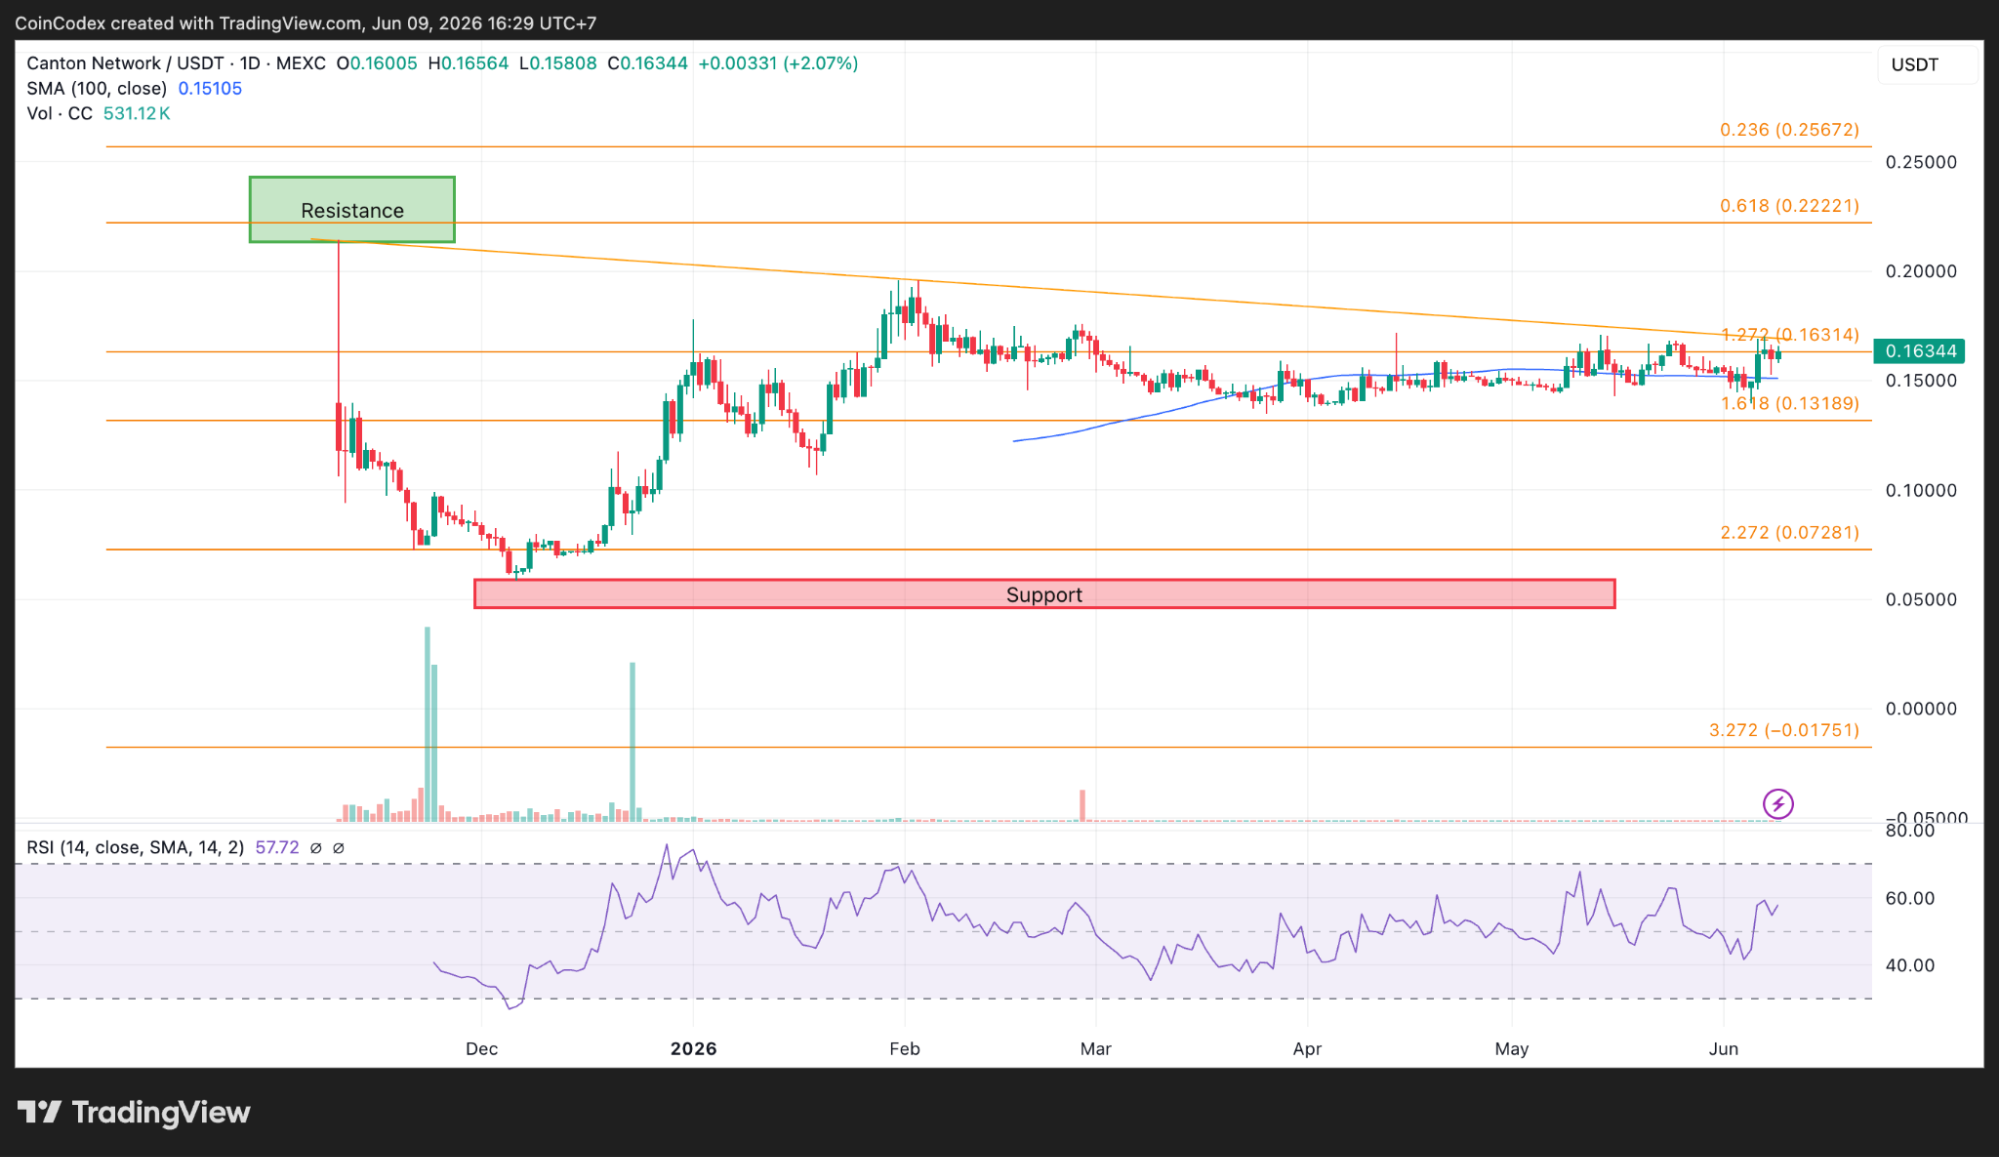
Daily CC chart analysis. Source: TradingView
Momentum indicators still leave room for upside. The daily RSI is sitting around 57–58, and the 4-hour RSI is close to 56.8, showing that buyers are active without pushing the market into overbought territory.
On-chain data points to improving conditions
The technical picture is supported by what is happening beneath the surface. Canton's market capitalization recovered from roughly $5.70 billion to nearly $6.35 billion before easing slightly to the current $6.19–$6.20 billion range.
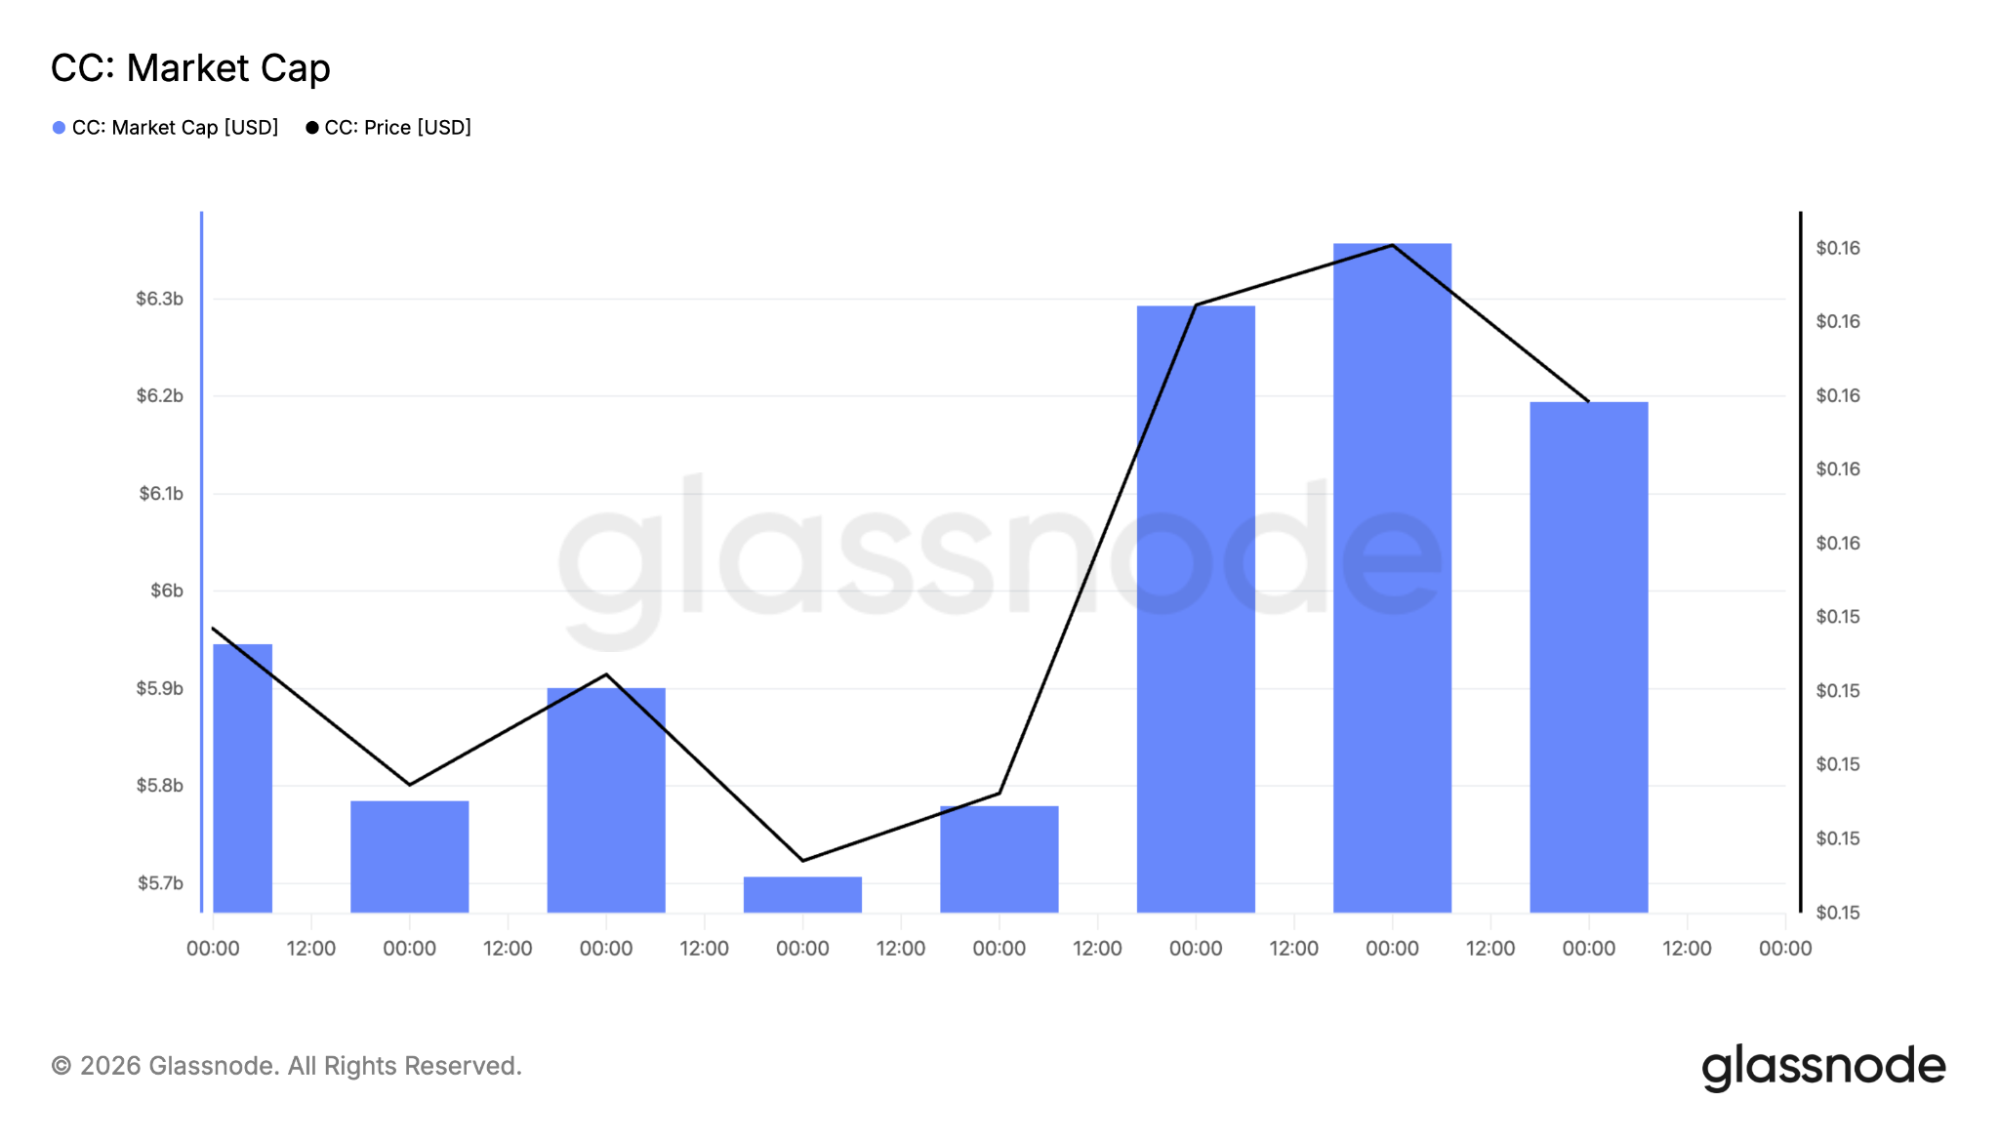
Canton market cap. Source: Glassnode
That recovery matches the bounce seen on the price chart and shows that fresh capital has returned after the earlier decline. The drawdown data also paints a relatively healthy picture.
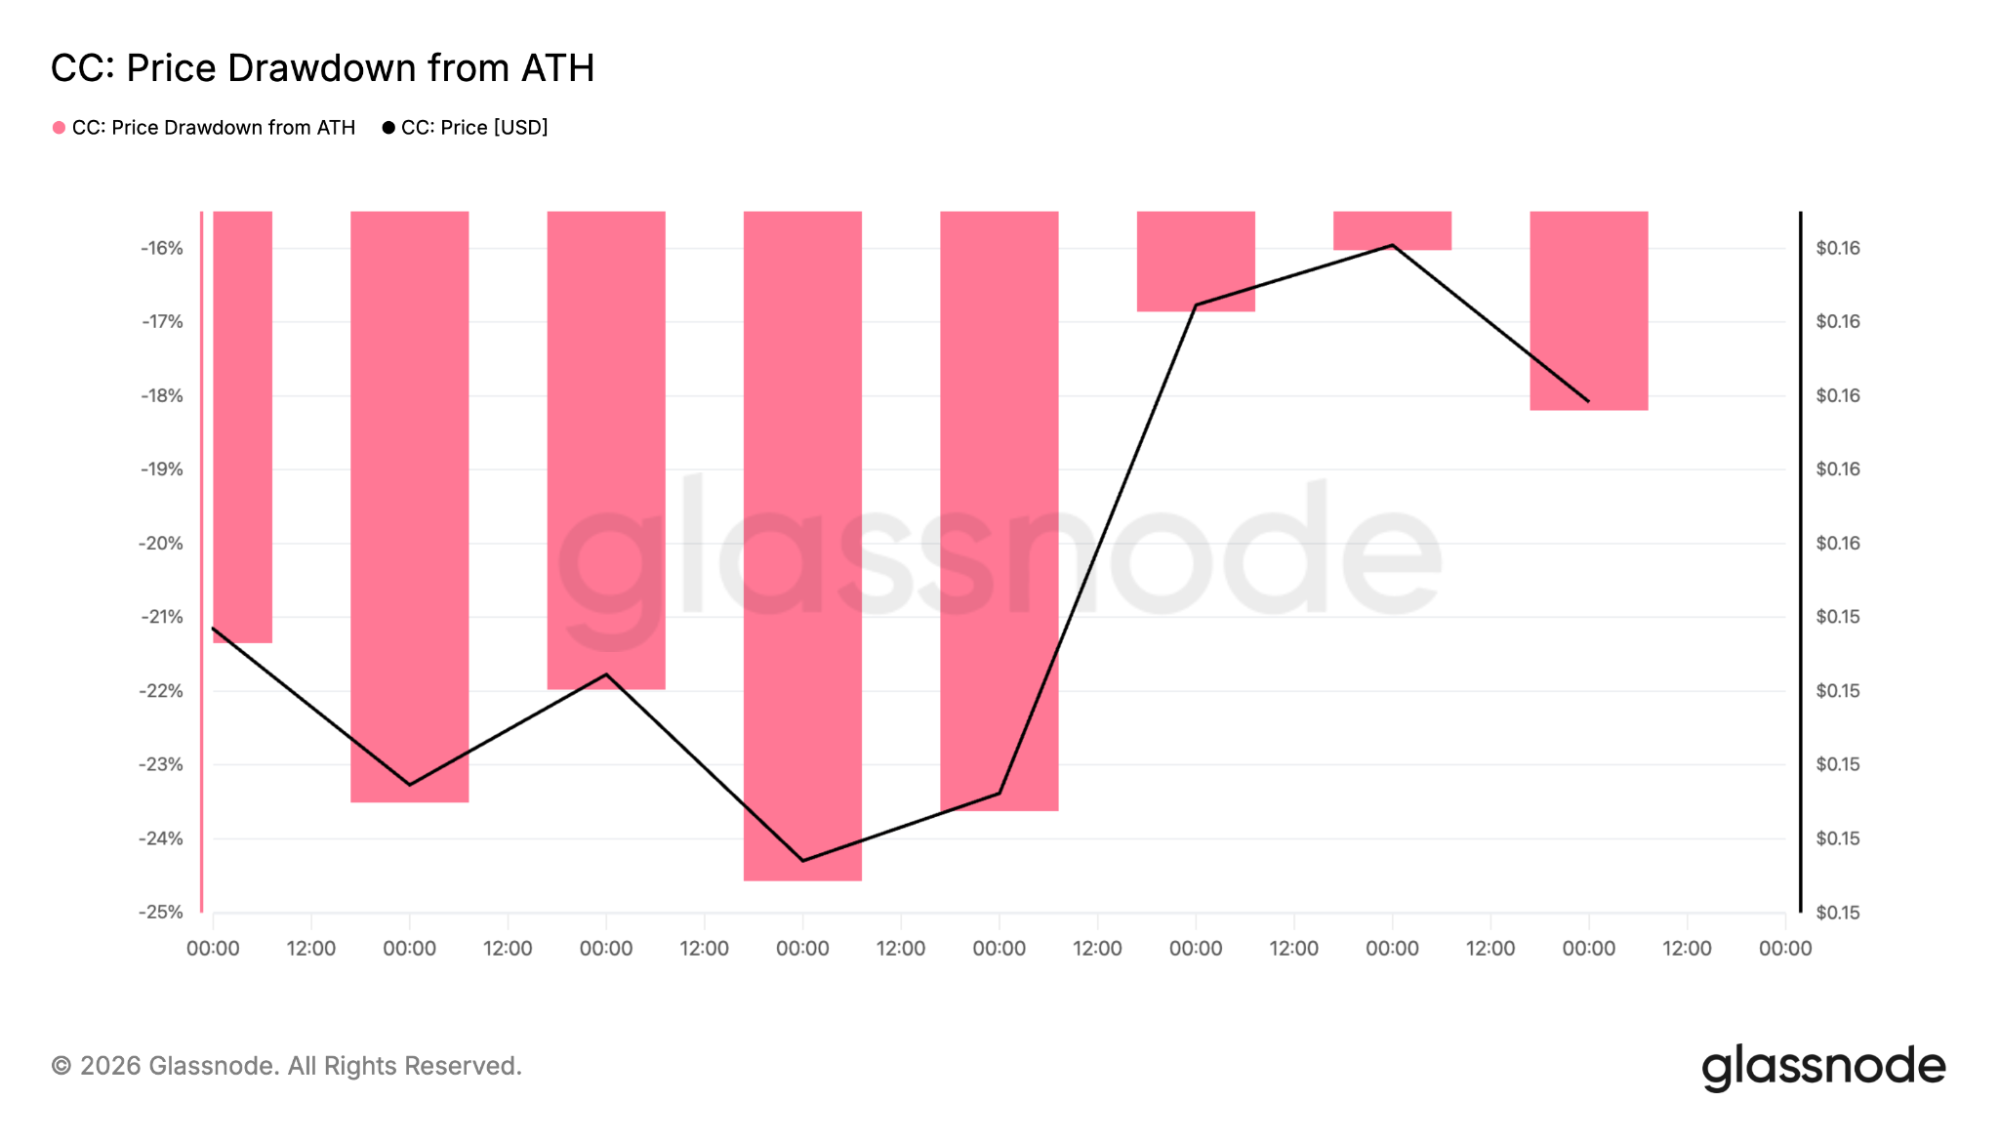
Price drawdown from ATH. Source: Glassnode
The CC price moved from a drawdown of approximately 24.5% from its all-time high to around 16% before settling near 18%. Compared with many digital assets that remain 50% or more below previous peaks, Canton has managed to preserve much of its earlier recovery.
Institutional developments could become the next catalyst
The technical setup is only part of the story. One of the biggest developments is Grayscale's spot Canton ETF filing submitted on June 5, 2026. If approved, the product would create a regulated entry point for institutional investors looking to gain exposure to the network.
There is one statistic investors continue to watch closely, though. Around 89% of the circulating CC supply is controlled by the 100 largest wallets. That concentration creates additional volatility because large holders can move the market with relatively few transactions.
The Depository Trust & Clearing Corporation is preparing a tokenisation pilot expected to begin with a soft launch in July 2026. The project focuses on tokenised U.S. Treasury securities and represents one of Canton's largest real-world use cases to date.
If adoption grows, increased network activity feeds directly into Canton's burn-mint model, where transaction fees are burned, and new tokens are minted as rewards. Governance updates also encourage Super Validators to lock a portion of earned CC tokens, reducing immediate selling pressure.
Where could the CC price go next?
Everything comes back to two price zones. The first sits between $0.175 and $0.18. A breakout above that resistance with stronger trading volume would strengthen the bullish case and put the next targets around $0.20.
The second level is between $0.138 and $0.14. Buyers have defended that area several times throughout the year, making it the foundation of the current structure. Losing that level would weaken the bullish outlook and expose downside targets near $0.13 and potentially $0.10.
CoinCodex’s 1-month CC price prediction places the price at $0.1211, which is below current trading levels and indicates that analysts expect the token to remain under pressure unless it breaks above key resistance and attracts stronger buying interest.


You May Also Like
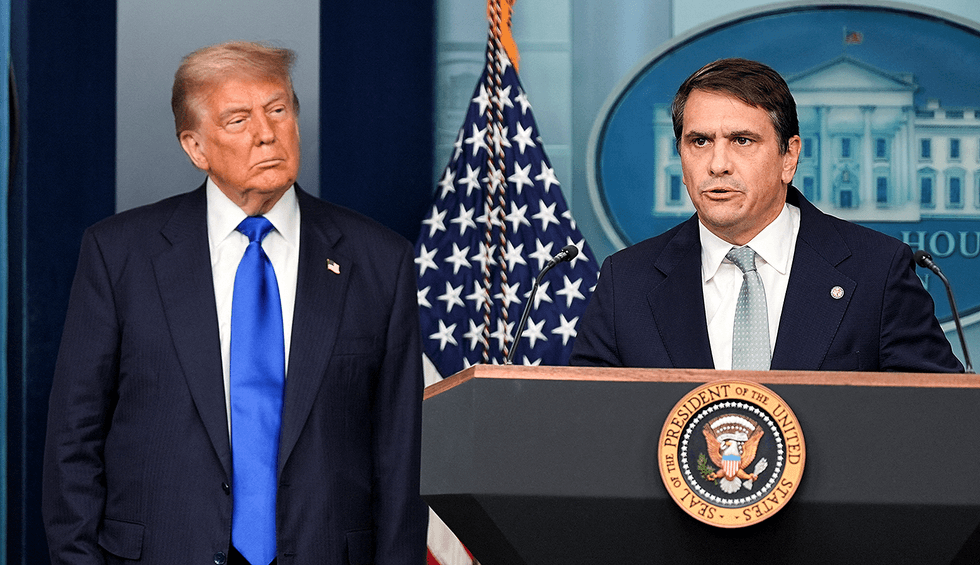
GOP strategist: Trump will be on the warpath if Todd Blanche doesn't get confirmed

US-Iran Nuclear Talks Near Breakthrough on 15-Year Freeze, NYT Reports
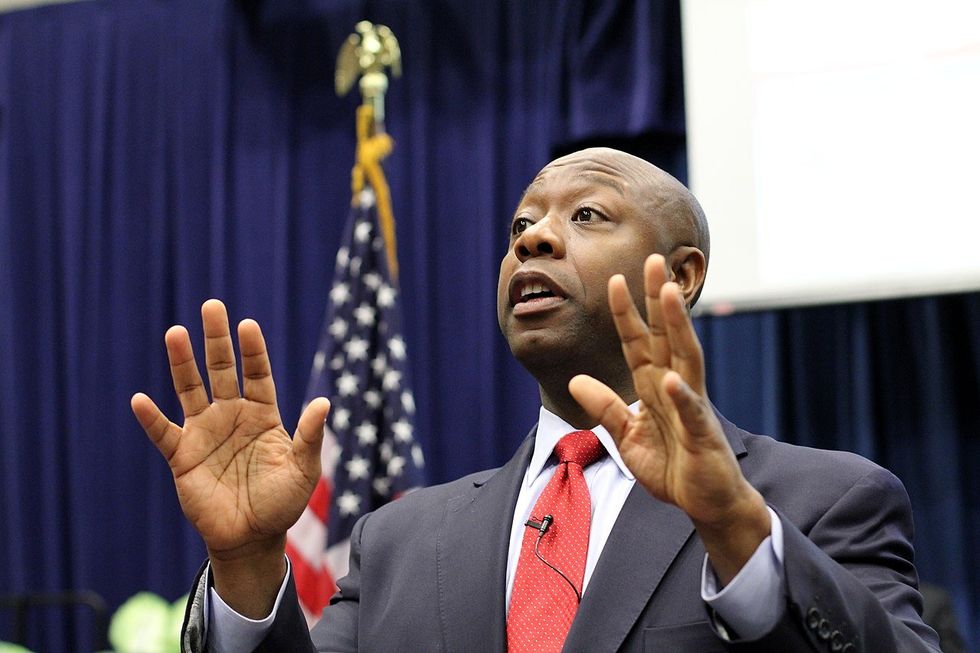
Republicans cornered with 'bleak' numbers at private GOP meeting


