

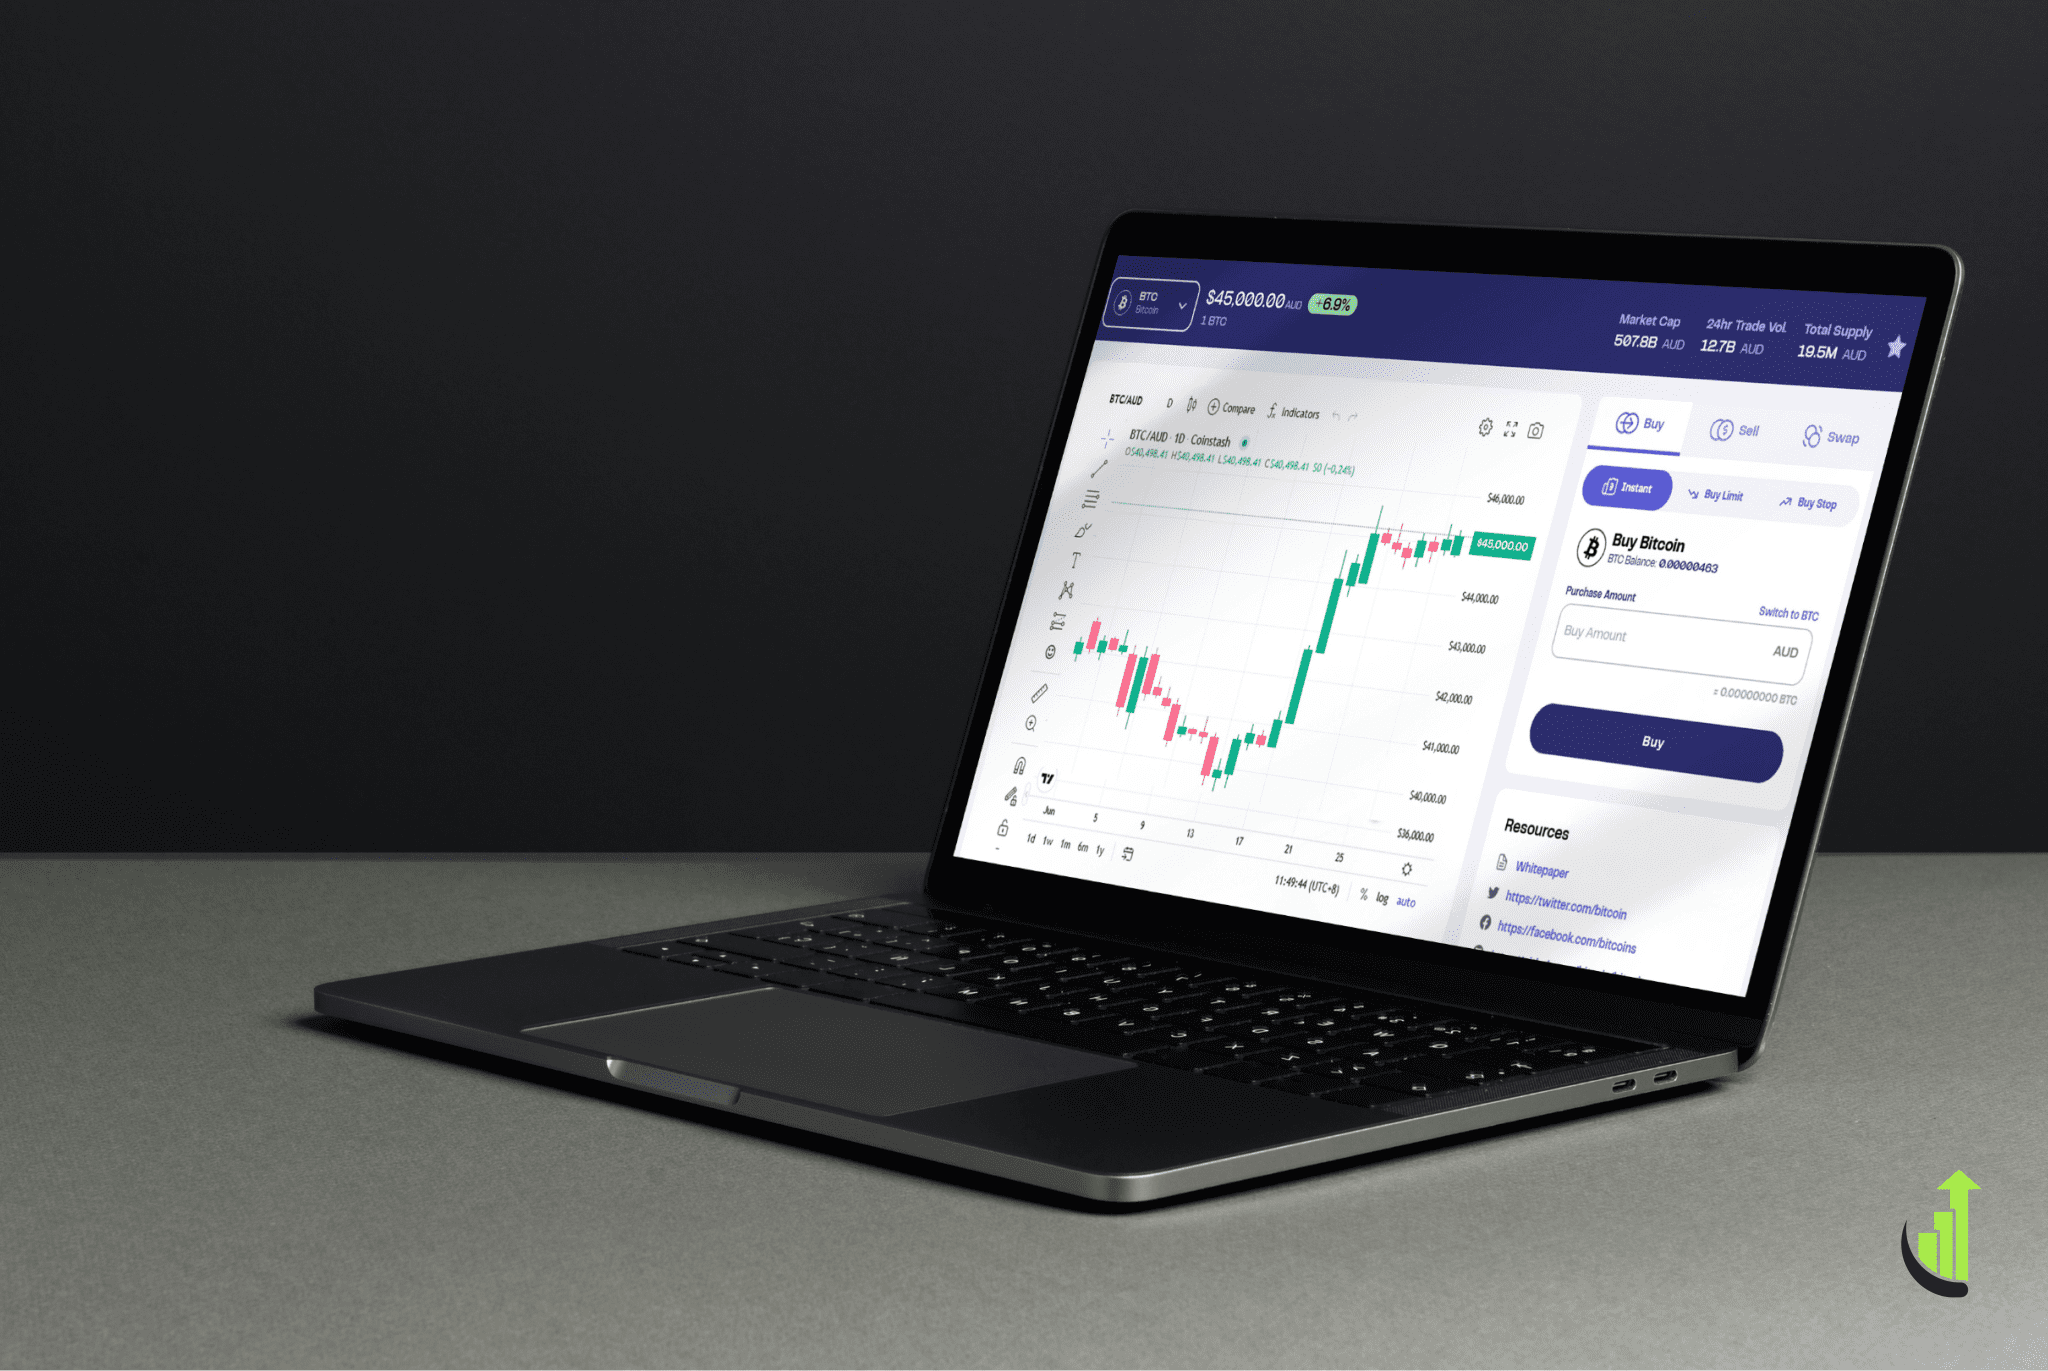
HBAR News 2026: Hedera Seeks Stabilization Above Support
The HBAR is currently trading between close to $0.086, and the recent charts indicate that Hedera is attempting to stabilize and not commence a new strong rally.
And that leaves Hedera in a waiting period. The market is not declining at a rapid rate, but it is not indicating the sort of momentum that tends to lead to a breakout. The image is at present stable, wary, and circumscribed.
CoinMarketCap Softly Slides Intraday
CoinMarketCap ranks HBAR at $0.08625, a 3.4% decrease in the last 24 hours. In the chart, the $0.089 level at the beginning of the session slowly fell towards the mid-range of the $0.085 level, followed by a small rebound later in the day.
That movement on the CoinMarketCap price chart is more of a deflation than a panic dump. HBAR has indeed lost ground over the bulk of the session, but the late recovery indicates that buyers continue to buy on the lower end of the range.
It is also indicated that the market cap is $3.73 billion, the 24-hour volume is $65.03 million, and it has an unlocked market cap of $4.07 billion. Volume is increasing (11.82), indicating that there is still activity going on as the price moves down.
Narrow Daily Range In The Market Data
Also, HBAR is trading at $0.08606, which is 2.50% lower in 24 hours. The day’s low sits at $0.08608, while the high reaches $0.08972.
According to the BraveNewCoin chart, it indicates a grind downward rather than an abrupt directional action. HBAR begins the day at the higher part of the range and drifts down through the day before leveling towards the end.
The general market outlook remains low as well. On the market, there are $3.73 billion of market cap, $60.08 million of volume, and 43.32 billion of HBAR available. The token is still 84.86% below its all-time high of $0.57; that leaves the long-term recovery story incomplete.
Technicals Show an Urgent Market
Interestingly, the technical chart indicates that HBAR was trading at $0.08623 upon opening, reached a high of $0.08623 and a low of $0.08619, and was trading around $0.08620 at the moment. That is a very narrow band, and that is a simple tale; the market is moving, but just a little.
The TradingView indicators are in favor of that reading. The histogram of the MACD is almost flat at -0.00001, with MACD and signal lines almost congregated around zero. That generally indicates a market that has very little short-term momentum.
RSI is neutral, too. The graph indicates that the RSI is 49.93, and the average is around 52.43. HBAR is not experiencing overselling. It is in place, awaiting a more powerful catalyst.
The 2026 Outlook of Hedera is Based on Regaining Momentum
The charts currently indicate that Hedera is on support and is yet to gain momentum. The market has established some equilibrium at the level of $0.086, and that is important. It demonstrates that buyers are not yet ready to protect the area.
Future prices in 2026 are expected to remain stable but modest until this equilibrium occurs. Hedera is not disintegrating. It is just awaiting sufficient momentum to establish a clearer direction.


You May Also Like

South Korea draft crypto bill covers stablecoins, RWAs
SGoldmanIfa com: Why Automated Compliance is the Future of Trading in Canada


