

Expert Says This One Ethereum Level Could Decide Next Breakout: ETH Price Analysis
ETH trades near $2,337 as analysts watch a $3,056 daily close to confirm a breakout after rebounding from $1,765.
Ethereum is trading near a key price area after a sharp fall and a steady rebound. A market analyst said one level may decide whether ETH extends higher or stalls again.
The view comes as traders watch resistance, support, and momentum signals on the daily chart.
ETH Rebounds After Steep Decline
Ethereum fell from about $4,800 to nearly $1,765 during its recent downtrend. That move erased much of the prior rally and shifted market sentiment.
Since then, price has recovered in a slower and more orderly way. The analyst said the recent low near $1,765 may now serve as a working bottom.
However, the recovery has not yet confirmed a full trend change. Price remains below the area that would signal stronger control by buyers.
The daily Bitstamp chart shows ETH near $2,337 at the time of the analysis. That places the price above the rebound base around $1,900 to $2,000.
This zone remains an important support area for the current recovery. The broader chart structure still looks mixed despite the recent bounce.
The long-term uptrend weakened after the rejection from the $4,600 to $4,800 range. Even so, buyers have defended lower levels in recent weeks.
Gap Zone and Resistance Levels Draw Attention
The analyst said Ethereum is now sitting below an unfilled gap between $2,474 and $2,634. That range is being watched as the next upside target.
A move into that zone could test whether demand remains strong. Before that, ETH has to hold above the near-term pivot around $2,300 to $2,350.
That area has become an important short-term marker on the chart. If price stays above it, buyers may try to press higher.
The analyst also pointed to a recent false breakout near $2,385. Price briefly moved above a rising channel, trapped buyers, and then returned inside it.
That move suggested the market still lacks clean breakout confirmation.
Above the gap, the next resistance sits between $2,900 and $3,050. The analyst said a daily close above $3,056 would change the chart structure.
In the analyst’s words, that would mark a “full trend reversal.”
Read Also:
Momentum Improves, but Support Still Matters
Momentum indicators have started to improve on the daily chart. The MACD has turned positive, and the MACD line sits above the signal line.
That setup often shows building bullish momentum. The RSI is near 60, which suggests stronger price action without overbought conditions.
This leaves room for more upside if buyers remain active. Still, momentum alone does not confirm a breakout.
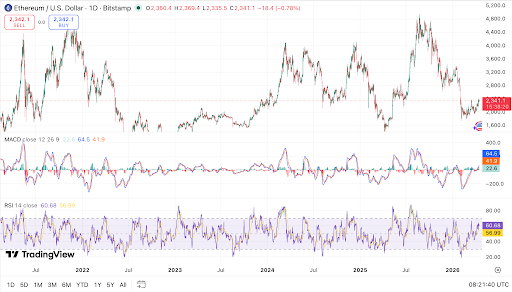 Ethereum rebounds above $2,300 as momentum indicators turn modestly bullish: Source: TradingView
The analyst said ETH is “recovering but hasn’t proven itself yet.” That view matches the current chart setup and price location.
The market remains between support below and resistance above. On the downside, the analyst pointed to $1,800 as the key support to watch.
A break below $1,765 would weaken the recovery and raise pressure on buyers. Until then, the chart reflects a short-term bullish rebound inside a broader neutral structure.
For now, the focus remains on whether Ethereum can reclaim the gap zone and then challenge $3,056.
If that level breaks on a daily close, the market may shift into a stronger uptrend. Until that happens, traders are likely to keep watching the same levels closely.
The post Expert Says This One Ethereum Level Could Decide Next Breakout: ETH Price Analysis appeared first on Live Bitcoin News.


You May Also Like

UK Economic Growth Outperforms Expectations, Yet Bank of England MPC Remains Cautious – TD Securities Analysis

Trump team now wants three massive arches built across Washington, D.C.


