

Dogecoin Nears Explosive Weekly Close as Breakout Fuels Bullish Momentum
Dogecoin nears a weekly close with RSI breakout, while price trades near $0.096 and resistance stands at $0.0987.
Dogecoin is approaching a key weekly close as traders watch a possible breakout on the RSI chart.
The setup has drawn fresh attention because momentum is improving on both weekly and daily timeframes.
Even so, price remains near a key resistance zone, and confirmation is still required before a broader move can be established.
Weekly RSI Breakout Draws Market Attention
A recent Dogecoin weekly chart shared by Trader Tardigrade focused on the RSI rather than price alone.
The chart showed the weekly RSI compressing inside a shrinking triangle before moving higher.
The post said, “Dogecoin RSI coiled into a shrinking triangle and it’s now breaking out.”
That signal matters because RSI breakouts can point to a change in momentum before price fully reacts.
In earlier Dogecoin cycles, similar RSI moves were followed by strong price advances.
For that reason, traders are now watching whether the current weekly candle can close above the breakout area.
The weekly chart also shows Dogecoin trading far below its 2021 peak. Even so, momentum conditions appear different from recent months.
Selling pressure seems weaker, and buyers are starting to regain some control on the higher timeframe.
Still, the weekly RSI signal remains an early sign and not a full confirmation. A breakout on the indicator needs support from price action.
Without that, the setup may lose strength and return to a slower range.
Price Holds Near Resistance as Bulls Seek Confirmation
On the daily chart, Dogecoin is trading near $0.096. Recent candles show that price has stabilized after a long decline.
Since mid-March, the token has moved mostly sideways between support near $0.090 and resistance near $0.0987.
That range is now important because a daily close above $0.0987 could improve the short-term structure.
If that happens, traders may start watching the next resistance levels near $0.1033 and $0.1060. Above those levels, the next major area appears around $0.1106.
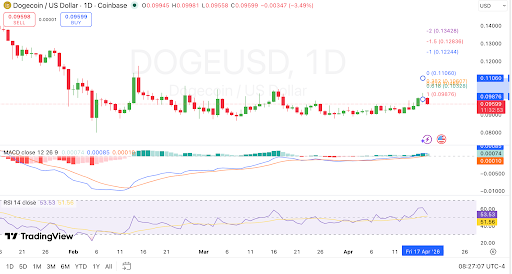 DOGE tests resistance near $0.0987 as momentum improves, source: TradingView.
At the same time, support remains clear on the downside. The $0.0900 level has held several times in recent weeks.
If that floor breaks, sellers may push the price back toward the $0.0850 to $0.0800 area.
The price structure shows that Dogecoin is trying to build a base. However, the market has not yet confirmed a wider breakout.
So, bulls still need stronger follow-through before momentum can move from technical signal to price trend.
Read Also:
Momentum Improves Across Indicators
The daily MACD is slightly positive, and the histogram remains green. That suggests momentum has improved from the earlier bearish phase.
In addition, the MACD line is still above the signal line, which supports a mild bullish reading.
The daily RSI is around 53.8, which is above the neutral level. That shows moderate strength, but not an overbought condition.
As a result, Dogecoin still has room to move higher if buyers remain active.
Taken together, the daily and weekly charts point to improving market conditions. The weekly RSI breakout has lifted attention, and the daily chart shows a stable base.
Yet both timeframes still depend on price holding support and breaking resistance.
For now, the market is focused on the weekly close and the nearby daily resistance zone.
If Dogecoin stays above the breakout area, bullish momentum may strengthen. If not, the token may continue trading in its recent range until a clearer direction appears.
The post Dogecoin Nears Explosive Weekly Close as Breakout Fuels Bullish Momentum appeared first on Live Bitcoin News.


You May Also Like

Market Strategist Says Trump Just Dropped a Major XRP Bombshell Live

Israel prepares for possible military action against Iran: Channel 12


