Dogecoin is back in the sights of investors, with more recent developments around a potential exchange-traded fund. Grayscale has filed to convert its Dogecoin Trust into a spot ETF, shining the spotlight on the meme-inspired cryptocurrency. The filing arrives as DOGE faces down losing price action, though market analysts think it could catalyze a bottom […]Dogecoin is back in the sights of investors, with more recent developments around a potential exchange-traded fund. Grayscale has filed to convert its Dogecoin Trust into a spot ETF, shining the spotlight on the meme-inspired cryptocurrency. The filing arrives as DOGE faces down losing price action, though market analysts think it could catalyze a bottom […]

Dogecoin Price Analysis: DOGE Eyes $0.38 Breakout Amid ETF Buzz

Dogecoin
  • Grayscale moves to turn Dogecoin Trust into a U.S. spot ETF, boosting investor sentiment.
  • Dogecoin shows buy signals on charts despite a 9.8% weekly price decline in the market.
  • SEC approval for a Dogecoin ETF could come by October, sparking hopes for a major rally.

Dogecoin is back in the sights of investors, with more recent developments around a potential exchange-traded fund. Grayscale has filed to convert its Dogecoin Trust into a spot ETF, shining the spotlight on the meme-inspired cryptocurrency. The filing arrives as DOGE faces down losing price action, though market analysts think it could catalyze a bottom in the near future.

Over the last seven days, the cryptocurrency has lost 9.8%. In the last 24 hours, DOGE down by 3.59% and is currently trading at $0.265. The daily trading volume dropped 30 percent to $2.6 billion, in a sign that activity was slowing. Yet even as the weakness persists, some technical analysts claim that DOGE is showing early signals of recovering.

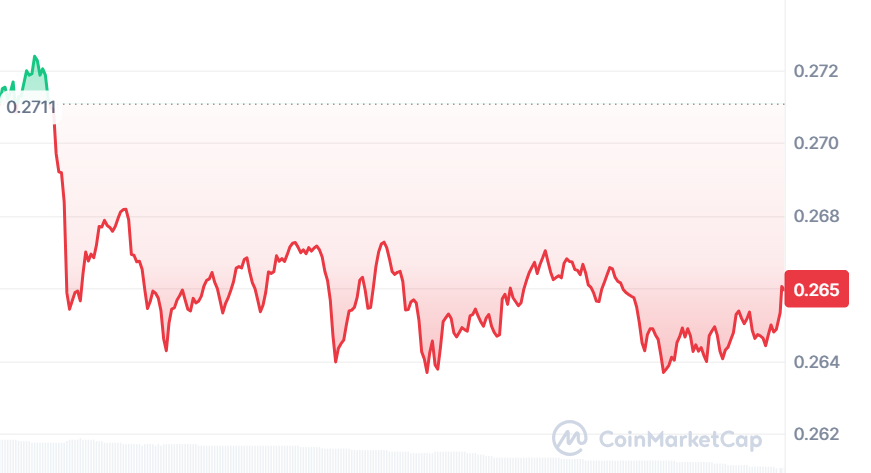
Source: CoinMarketCap

Analyst Ali noted that the 4-hour time frame has a buy signal from the TD Sequential indicator. This often indicates price turning points. The existing mess could create the opening for a short-term rally, if enough buyers come around, Ali said.
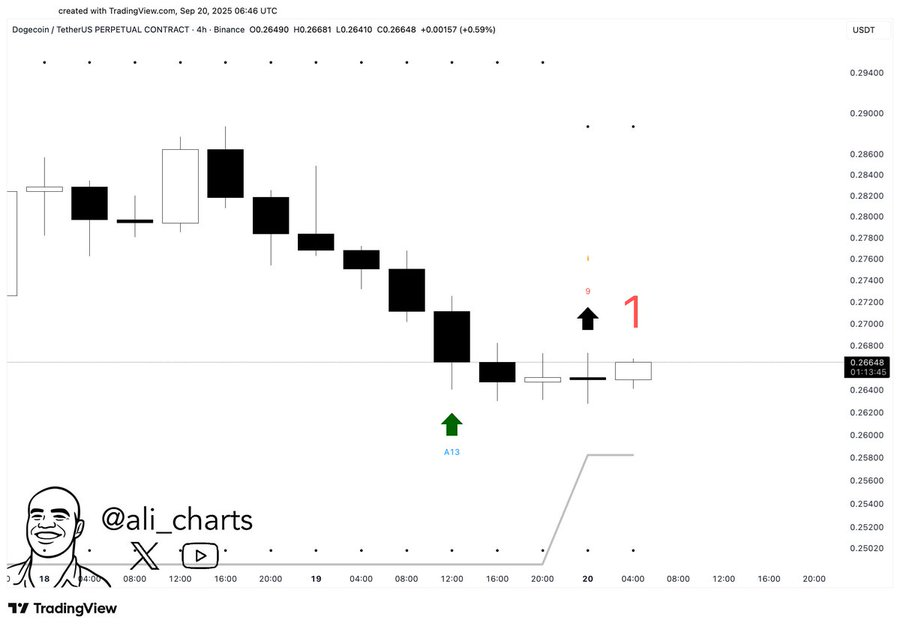
Source: X

DOGE Eyes $0.38 on Triangle Breakout

Another analyst Trader Tardigrade pointed out a second descending triangle appearing on the chart. The pattern consists of a horizontal support and a downward resistance. Following the breakout from the descending pattern, DOGE price could potentially rally toward $0.38.
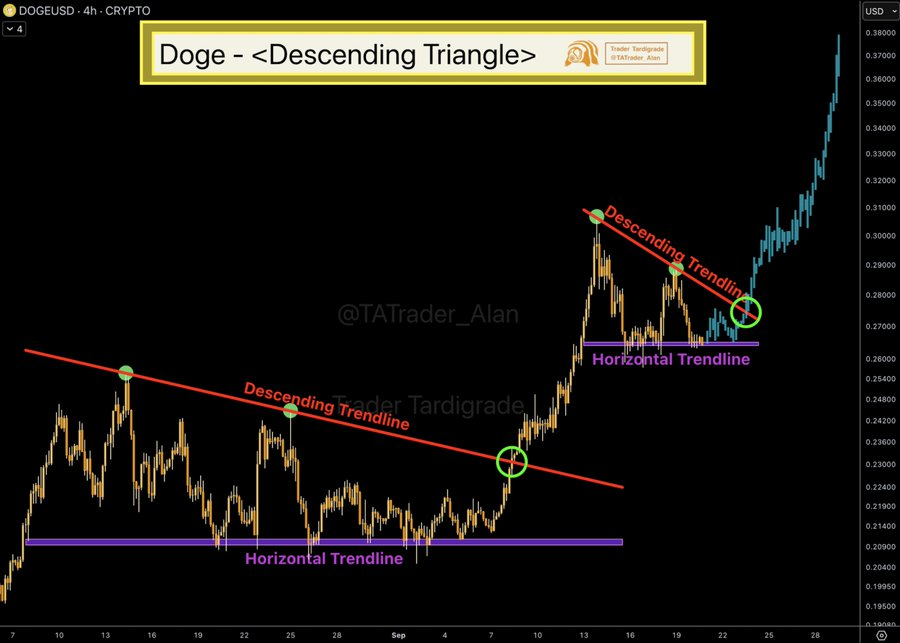
Source: X

The key test for Dogecoin on the weekly chart is with the Ichimoku cloud which is historically a strong trend signal. ” The last time the cloud was breached from above resulted in a massive uptrend,”analyst Cantonese Cat noted. Similar action could play out again, market watchers say, sending DOGE higher if upward momentum returns.

Also Read: Dogecoin Eyes Potential Rally With Key Target Near $0.30 Resistance

Regulatory momentum has meanwhile fueled the discussion. Grayscale has amended their S-1 registration with the U.S. Securities and Exchange Commission (SEC). The company hopes to convert its Dogecoin Trust into a spot ETF that would trade on NYSE Arca under the ticker GDOG if approved.

Regulatory Moves Put DOGE Back in Focus

The move underscores Grayscale’s play to extend crypto access via regulated funds. The NYSE Arca has already filed an application to list the Grayscale Dogecoin Trust. The new filing advances the proposal forward for potential approval, buoying investor sentiment around the token.

Meanwhile, investor sentiment has been boosted by the launch of the Rex-Osprey DOGE ETF (ticker: DOJE). That product has raised anticipation that the SEC will greenlight a spot ETF. Citing the fund, experts say that approval could come as soon as October and would be a game changer for Dogecoin.

The news comes amid a wider pullback in the crypto market. Bitcoin and Ethereum under pressure but DOGE attention returning. Traders are weighing a cautious attitude against hope that technical gauges and news about regulation might alter momentum.

A Dogecoin listing on a U.S. spot ETF would be a major boost for the coin and the broader market. With the signals on the charts supporting regulatory efforts, investors are waiting to see whether DOGE can mount a comeback. The meme coin may assert its resiliency yet again as the demand for regulated crypto investment products accelerates.

Also Read: Dogecoin ETF Taps $6 Million on Debut: How High Can the Price Climb?

Market Opportunity
Moonveil Logo
Moonveil Price(MORE)
$0.001928
$0.001928$0.001928
-1.07%
USD
Moonveil (MORE) Live Price Chart
Disclaimer: The articles reposted on this site are sourced from public platforms and are provided for informational purposes only. They do not necessarily reflect the views of MEXC. All rights remain with the original authors. If you believe any content infringes on third-party rights, please contact service@support.mexc.com for removal. MEXC makes no guarantees regarding the accuracy, completeness, or timeliness of the content and is not responsible for any actions taken based on the information provided. The content does not constitute financial, legal, or other professional advice, nor should it be considered a recommendation or endorsement by MEXC.

You May Also Like

Microsoft Corp. $MSFT blue box area offers a buying opportunity

Microsoft Corp. $MSFT blue box area offers a buying opportunity

The post Microsoft Corp. $MSFT blue box area offers a buying opportunity appeared on BitcoinEthereumNews.com. In today’s article, we’ll examine the recent performance of Microsoft Corp. ($MSFT) through the lens of Elliott Wave Theory. We’ll review how the rally from the April 07, 2025 low unfolded as a 5-wave impulse followed by a 3-swing correction (ABC) and discuss our forecast for the next move. Let’s dive into the structure and expectations for this stock. Five wave impulse structure + ABC + WXY correction $MSFT 8H Elliott Wave chart 9.04.2025 In the 8-hour Elliott Wave count from Sep 04, 2025, we saw that $MSFT completed a 5-wave impulsive cycle at red III. As expected, this initial wave prompted a pullback. We anticipated this pullback to unfold in 3 swings and find buyers in the equal legs area between $497.02 and $471.06 This setup aligns with a typical Elliott Wave correction pattern (ABC), in which the market pauses briefly before resuming its primary trend. $MSFT 8H Elliott Wave chart 7.14.2025 The update, 10 days later, shows the stock finding support from the equal legs area as predicted allowing traders to get risk free. The stock is expected to bounce towards 525 – 532 before deciding if the bounce is a connector or the next leg higher. A break into new ATHs will confirm the latter and can see it trade higher towards 570 – 593 area. Until then, traders should get risk free and protect their capital in case of a WXY double correction. Conclusion In conclusion, our Elliott Wave analysis of Microsoft Corp. ($MSFT) suggested that it remains supported against April 07, 2025 lows and bounce from the blue box area. In the meantime, keep an eye out for any corrective pullbacks that may offer entry opportunities. By applying Elliott Wave Theory, traders can better anticipate the structure of upcoming moves and enhance risk management in volatile markets. Source: https://www.fxstreet.com/news/microsoft-corp-msft-blue-box-area-offers-a-buying-opportunity-202509171323
Share
BitcoinEthereumNews2025/09/18 03:50
WTI drifts higher above $59.50 on Kazakh supply disruptions

WTI drifts higher above $59.50 on Kazakh supply disruptions

The post WTI drifts higher above $59.50 on Kazakh supply disruptions appeared on BitcoinEthereumNews.com. West Texas Intermediate (WTI), the US crude oil benchmark
Share
BitcoinEthereumNews2026/01/21 11:24
Fed forecasts only one rate cut in 2026, a more conservative outlook than expected

Fed forecasts only one rate cut in 2026, a more conservative outlook than expected

The post Fed forecasts only one rate cut in 2026, a more conservative outlook than expected appeared on BitcoinEthereumNews.com. Federal Reserve Chairman Jerome Powell talks to reporters following the regular Federal Open Market Committee meetings at the Fed on July 30, 2025 in Washington, DC. Chip Somodevilla | Getty Images The Federal Reserve is projecting only one rate cut in 2026, fewer than expected, according to its median projection. The central bank’s so-called dot plot, which shows 19 individual members’ expectations anonymously, indicated a median estimate of 3.4% for the federal funds rate at the end of 2026. That compares to a median estimate of 3.6% for the end of this year following two expected cuts on top of Wednesday’s reduction. A single quarter-point reduction next year is significantly more conservative than current market pricing. Traders are currently pricing in at two to three more rate cuts next year, according to the CME Group’s FedWatch tool, updated shortly after the decision. The gauge uses prices on 30-day fed funds futures contracts to determine market-implied odds for rate moves. Here are the Fed’s latest targets from 19 FOMC members, both voters and nonvoters: Zoom In IconArrows pointing outwards The forecasts, however, showed a large difference of opinion with two voting members seeing as many as four cuts. Three officials penciled in three rate reductions next year. “Next year’s dot plot is a mosaic of different perspectives and is an accurate reflection of a confusing economic outlook, muddied by labor supply shifts, data measurement concerns, and government policy upheaval and uncertainty,” said Seema Shah, chief global strategist at Principal Asset Management. The central bank has two policy meetings left for the year, one in October and one in December. Economic projections from the Fed saw slightly faster economic growth in 2026 than was projected in June, while the outlook for inflation was updated modestly higher for next year. There’s a lot of uncertainty…
Share
BitcoinEthereumNews2025/09/18 02:59