

Chainlink (LINK) Price Nears $10: Is a Breakout Finally Coming?

The post Chainlink (LINK) Price Nears $10: Is a Breakout Finally Coming? appeared first on Coinpedia Fintech News
Chainlink is surging by 1.13% to reach $9.50 with a significant rise in the volume of about 10.5%. The broader crypto market remains uncertain, but Chainlink is quietly approaching a key decision point. After weeks of consolidation, the LINK price is once again testing the $10 resistance zone—a level that has repeatedly capped upside attempts.
This isn’t just another test. Price action is tightening, volatility is compressing, and multiple indicators suggest that a larger move is building beneath the surface. But the bigger question remains—is this a real breakout setup, or another rejection waiting to happen?
On-Chain Activity Shows Weak Demand Growth
A closer look at network data reveals a concerning trend. Active addresses have remained volatile and largely stagnant, fluctuating between roughly 2.5K and 3.5K without any sustained growth.
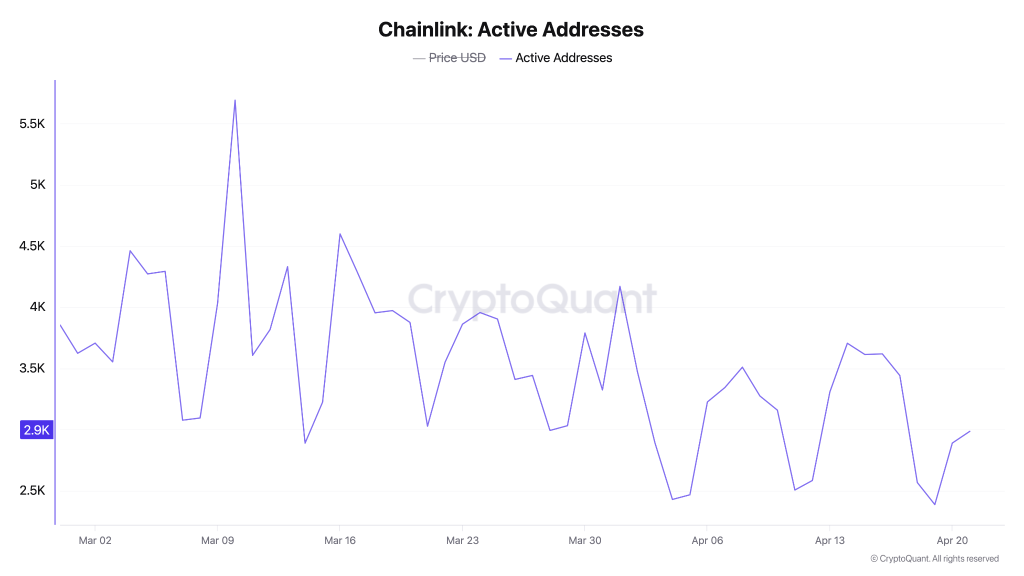
In a strong bullish phase, rising prices are usually supported by increasing network activity. However, that correlation is missing here. Despite LINK attempting to push higher, user participation is not expanding in a meaningful way. This disconnect suggests that the current move lacks organic demand, making the structure more fragile than it appears.
Exchange Outflows Signal Accumulation
On the other hand, exchange flow data tells a slightly different story. Exchange outflows have been gradually increasing, with recent spikes reaching around 3.4K LINK. This typically indicates that tokens are being moved off exchanges into private wallets, reducing immediate sell pressure.
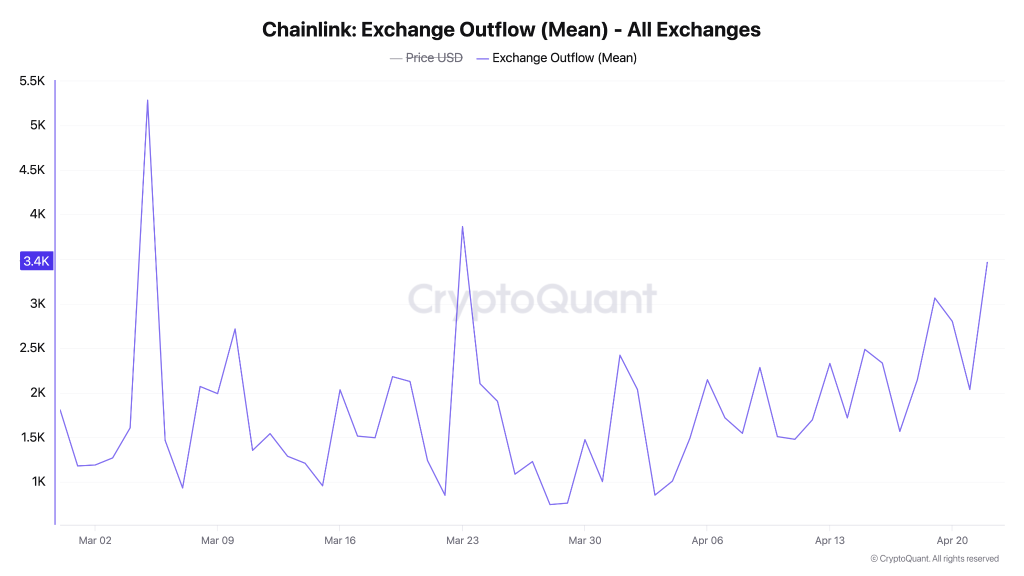
Such behavior is often associated with accumulation phases, where participants position themselves ahead of a potential move. However, accumulation alone is not enough. Without corresponding demand growth, it can easily turn into short-term positioning rather than long-term conviction.
Price Structure Shows Compression Near Breakout Zone
From a technical perspective, LINK is forming a symmetrical triangle, a classic pattern that often precedes a breakout. Price is compressing between rising support ($8.10 to $8.50) and flat resistance ($9.80 to $10.10), with volatility steadily declining. Currently, the price is approaching the resistance of a decisive triangle, and the indicators suggest a breakout could be on the horizon.
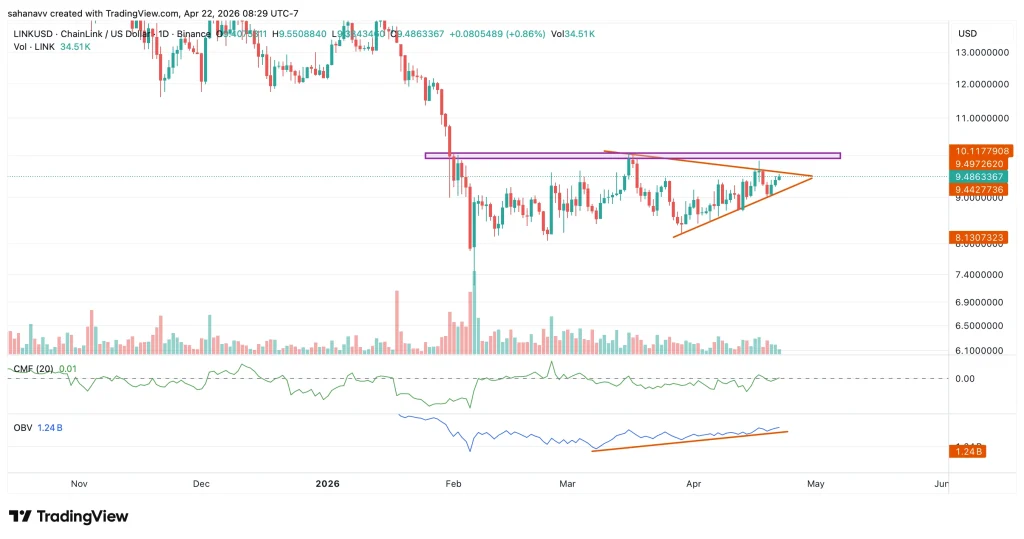
Momentum indicators appear to be indecisive, but a close observation suggests they are improving. The CMF has rebounded and is heading towards the average zone, suggesting liquidity is entering the token. Besides, the OBV has been rising consistently, indicating the rally is slowly flipping bullish. This creates a coiled setup, where the market is preparing for a move but hasn’t yet committed to a direction.
Therefore, if the LINK price breaks above $10.10 and holds, momentum could accelerate towards $10.80 to $11.50. Besides, a breakdown below the support could push LINK back toward $8.50 to $8.10.
Wrapping It Up
Chainlink is approaching a critical turning point, with price compressing near a major resistance level. While accumulation signals are building, the lack of strong network growth raises concerns about the sustainability of any breakout. Until the LINK price confirms strength above $10 with volume and participation, this remains a high-risk setup where a fake breakout is just as likely as a real one.


You May Also Like

TAP, Inc. Launches TAP Pay, a Verified Payments Layer for Peer and SMB Payments

Ruby red state Republicans fear new White House map would accidentally help Dems


