

Silver Price Analysis: Advances Stall at Technical Confluence Near $75 — Critical Resistance Ahead
BitcoinWorld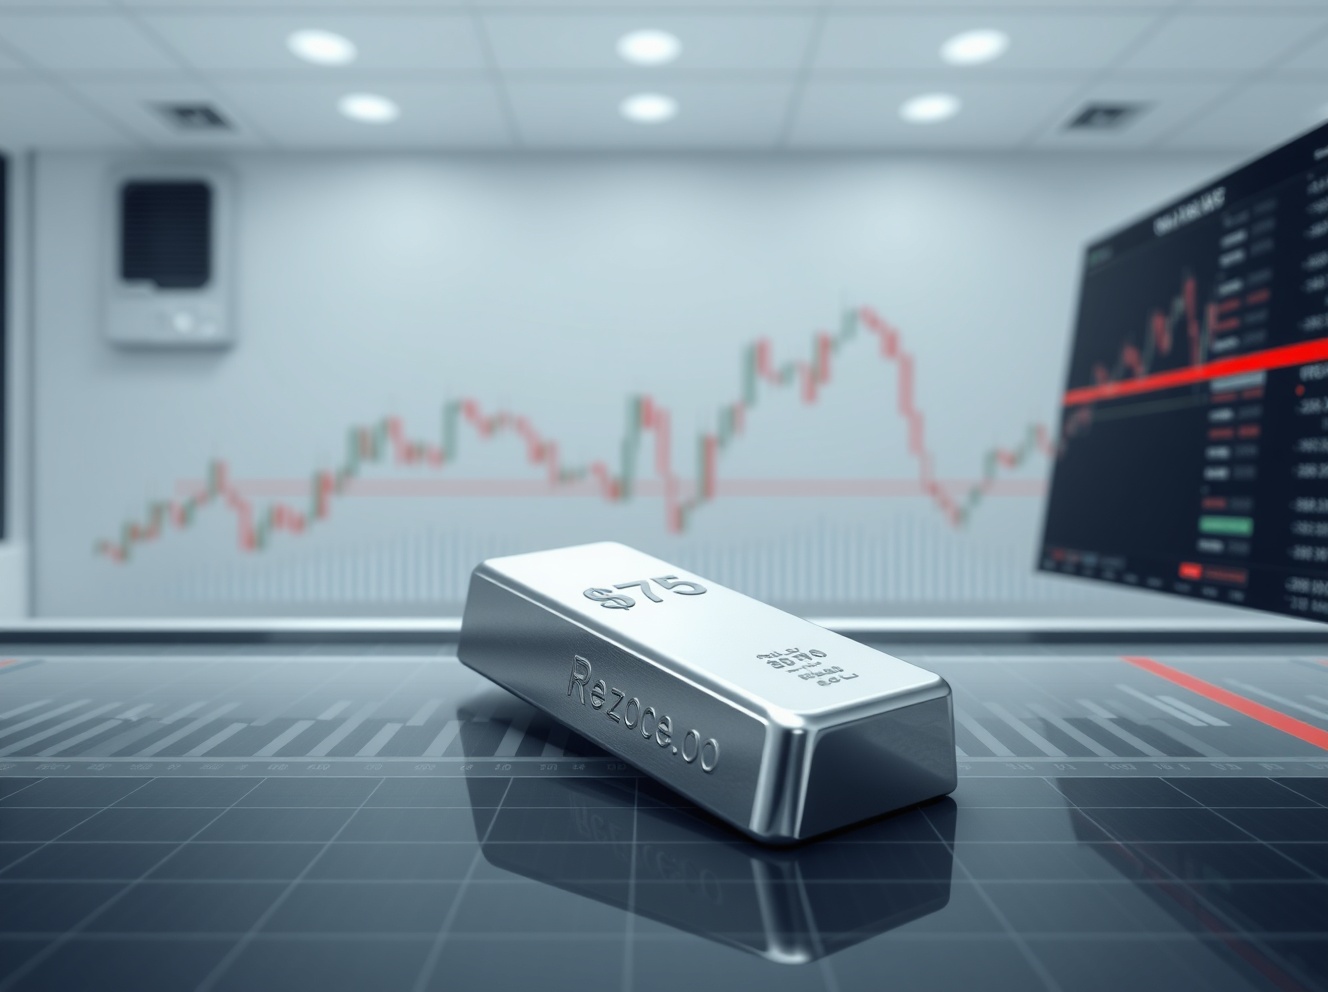
Silver Price Analysis: Advances Stall at Technical Confluence Near $75 — Critical Resistance Ahead
Silver price analysis reveals a critical juncture for the precious metal as recent advances stall at a technical confluence near the $75 mark. This level represents a significant resistance zone, combining multiple technical indicators and previous price action. Traders and investors now watch closely for a decisive breakout or reversal.
Silver Price Analysis: The $75 Technical Confluence
The $75 level acts as a powerful magnet for silver price analysis. It brings together several key technical factors. First, it aligns with a 61.8% Fibonacci retracement level from the previous major move. Second, it coincides with a horizontal resistance line that has capped prices multiple times since 2024. Third, the 200-day moving average also converges near this zone.
This confluence creates a strong barrier. Silver price analysis shows that each attempt to breach $75 has faced heavy selling pressure. The most recent advance, which began in early March, gained momentum but lost steam exactly at this level. Market participants now assess whether the metal has enough bullish energy to overcome this hurdle.
Key Technical Indicators at the Confluence
- Fibonacci retracement: The 61.8% level from the $60 to $90 range sits at $75.40.
- Horizontal resistance: Price rejected at $75.20 in October 2024 and again in January 2025.
- Moving average: The 200-day simple moving average currently lies at $74.80.
- Relative Strength Index (RSI): The daily RSI reads 68, nearing overbought territory.
- Volume profile: High trading volume clusters around $74.50 to $75.50, indicating strong market interest.
These factors collectively reinforce the significance of the $75 zone in silver price analysis. A break above this level could open the door to $80, while a rejection might lead to a pullback toward $70.
Market Drivers Behind Silver’s Recent Advance
Several fundamental factors have fueled silver’s recent rally. Industrial demand continues to rise, driven by solar panel manufacturing and electronics. Silver is a critical component in photovoltaic cells and 5G technology. Global green energy initiatives have boosted consumption significantly.
Monetary policy also plays a role. The Federal Reserve’s pivot toward rate cuts in late 2024 weakened the US dollar. A weaker dollar typically supports precious metals prices. Silver, often called “poor man’s gold,” benefits from this environment.
Geopolitical tensions add another layer. Ongoing conflicts in Eastern Europe and the Middle East increase safe-haven demand. Silver, while more industrial than gold, still attracts避险资金 during uncertainty. These combined forces have pushed silver price analysis to focus on the $75 resistance.
Industrial Demand vs. Investment Demand
| Demand Type | 2024 Data | 2025 Forecast |
|---|---|---|
| Industrial (tons) | 22,500 | 24,000 |
| Investment (tons) | 8,200 | 7,800 |
| Jewelry (tons) | 7,100 | 7,300 |
Industrial demand now accounts for over 55% of total silver consumption. This structural shift supports higher prices over the long term. However, investment demand has softened slightly as some traders take profits near resistance.
Silver Price Analysis: What Happens Next?
The current price action presents two main scenarios. In the bullish case, silver breaks above $75 with strong volume. This would confirm the breakout and target the next resistance at $78.50, then $80. A sustained move above $80 could retest the 2024 highs near $90.
In the bearish case, rejection at $75 leads to a decline. Initial support lies at $72, followed by the 50-day moving average at $70.50. A deeper correction could test $68, the previous consolidation zone. Silver price analysis suggests that a close below $70 would invalidate the bullish structure.
Volume analysis provides clues. The recent advance occurred on declining volume, which often signals weakening momentum. A breakout would require a volume spike of at least 20% above the 20-day average. Without this, the $75 resistance may hold.
Expert Perspectives on Silver’s Outlook
Market analysts remain divided. Some see silver as undervalued relative to gold. The gold-to-silver ratio currently stands at 85, above the historical average of 60. A mean reversion would imply silver outperforming gold.
Others caution that silver’s industrial exposure makes it vulnerable to economic slowdowns. If global manufacturing contracts, demand could drop sharply. This dual nature makes silver price analysis particularly complex.
“Silver sits at a crossroads,” notes a senior commodities strategist. “The technical picture is clear, but the fundamental backdrop is mixed. Traders should watch the $75 level closely for direction.”
Timeline of Silver’s Journey to $75
- January 2025: Silver trades at $68.50, forming a base above support.
- February 2025: Rally begins, breaking above $70 on Fed rate cut expectations.
- March 2025: Price accelerates, reaching $74.80 before stalling.
- Early April 2025: Attempts to breach $75 fail, with daily closes below resistance.
- Current: Price consolidates between $73.50 and $74.80, awaiting catalyst.
This timeline highlights the methodical advance and the critical nature of the current phase. Each rally leg has faced increasing resistance, making the $75 breakout a defining moment for silver price analysis.
Impact on Traders and Investors
The stalling at $75 creates opportunities and risks. Short-term traders can scalp the range, buying near $73 and selling near $75. However, tight stops are essential given the potential for a breakout or breakdown.
Long-term investors may view any pullback as a buying opportunity. The structural demand story remains intact. Dollar-cost averaging into silver positions near support levels can reduce timing risk.
Options markets show increased activity around $75 strikes. Implied volatility has risen, suggesting traders expect a significant move. Silver price analysis must account for this heightened uncertainty.
Conclusion
Silver price analysis highlights a pivotal moment as advances stall at the technical confluence near $75. This level combines Fibonacci, moving average, and horizontal resistance, creating a formidable barrier. The outcome will likely set the trend for the coming weeks. A breakout above $75 could propel silver toward $80, while a rejection may trigger a correction to $70. Traders should monitor volume, RSI, and fundamental drivers for confirmation. The silver market remains dynamic, offering both risks and rewards for informed participants.
FAQs
Q1: What is the significance of the $75 level in silver price analysis?
A1: The $75 level is a technical confluence zone where multiple indicators converge, including a 61.8% Fibonacci retracement, horizontal resistance, and the 200-day moving average. It acts as a major resistance point.
Q2: What happens if silver breaks above $75?
A2: A confirmed breakout above $75 with strong volume could target the next resistance at $78.50 and then $80. It would signal a bullish continuation of the uptrend.
Q3: What are the key support levels if silver rejects $75?
A3: Initial support lies at $72, followed by the 50-day moving average at $70.50. A deeper correction could test $68, the previous consolidation zone.
Q4: How does industrial demand affect silver price analysis?
A4: Industrial demand, driven by solar energy and electronics, now accounts for over 55% of silver consumption. Strong industrial demand supports higher prices, while a slowdown could pressure silver.
Q5: Is silver a good investment in 2025?
A5: Silver offers potential due to industrial demand and monetary policy tailwinds. However, its volatility and dual nature require careful risk management. Diversification and a long-term perspective are recommended.
This post Silver Price Analysis: Advances Stall at Technical Confluence Near $75 — Critical Resistance Ahead first appeared on BitcoinWorld.


You May Also Like

MAGA gullibility explains this one delusion they share: report
Why API3 Just Soared 32.96% in 30 Minutes


