

XRP Triangle Tightens as Traders Watch for a Fast Breakout Move Ahead
XRP trades near $1.4269 as triangle pattern tightens, with $1.3567 support and $1.5954 resistance in focus.
XRP traded near a key support zone as its hourly chart showed a tightening triangle pattern.
The setup has drawn attention because narrow ranges can lead to fast price moves.
Traders are watching whether XRP can break above nearby resistance or lose support.
Market data showed XRP near $1.4269, with support near $1.3567 and resistance near $1.5954. A confirmed breakout may shape the next short-term trend for the token.
XRP Triangle Pattern Draws Market Attention
According to Skipper, “$XRP is tightening inside a triangle pattern on the hourly chart – a setup traders often watch before a breakout.”
The market comment said price compression between support and resistance may be building momentum.
Skipper also said a decisive move from the pattern could trigger a sharp swing.
The post added that many traders are watching for a possible 10% move soon, as the market prepares for its next direction.
The comment also mentioned DEX Pro as a tool for market data, charts, and analytics. It described the platform as a command center for the decentralized market.
The statement was promotional, while the market setup remains tied to price confirmation.
XRP was trading near $1.4269 on the daily chart. The token remained above the marked support zone near $1.3567.
A break from the hourly triangle could decide the next short-term trend.
XRP Price Holds Above Key Daily Support
The daily chart shows XRP holding above the $1.3567 support area. This level is important because it marks a recent swing low.
A daily close below it could bring more selling pressure. The next lower demand area sits between $1.30 and $1.35.
If sellers push prices below that zone, traders may watch $1.00 to $1.10. Those levels remain psychological and historical support areas.
Resistance begins near $1.5954. This level matches the 0.786 Fibonacci retracement from the current chart structure.
A close above it could improve the short-term outlook. The next resistance is near $1.7827.
A move above that level could open the way toward $1.91 and $2.05. Buyers would need steady volume to confirm strength.
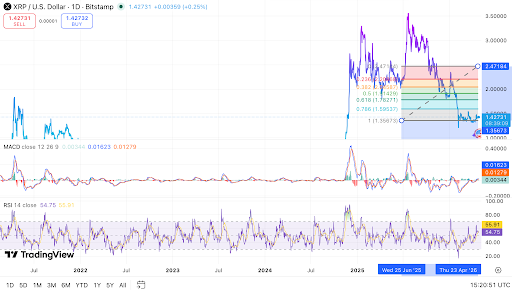 XRP daily chart shows price holding above key support.Source: TradingView
The MACD shows early improvement on the daily chart. The MACD line is slightly above the signal line.
The histogram is also positive, which points to mild bullish momentum. However, the signal remains early.
Price still needs to move above resistance before the recovery becomes stronger. Without that move, the wider trend remains under pressure.
The RSI is near the mid-50s. This reading is neutral to slightly bullish. It also shows that XRP is not yet overbought.
The broader trend remains bearish to neutral. XRP is still below several major retracement levels. It also remains below the descending structure from earlier highs.
Read Also:
Long-Short Data Shows Crowded Bullish Positioning
Derivatives data shows that XRP traders are leaning long. The Binance XRP/USDT account long-short ratio stood at 2.3445. The OKX XRP account ratio was 2.12.
Top trader data also showed a long bias. Binance top trader accounts had a ratio of 2.6258. The top trader position ratio was lower at 1.6314.
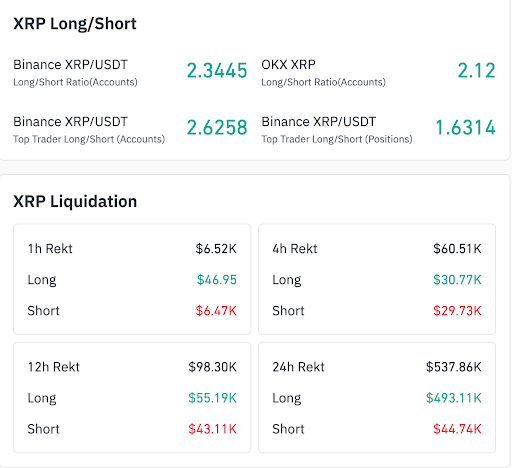 XRP derivatives data shows long bias and liquidation pressure. Source: Coinglass.
This means many accounts are long, but position size is less aggressive. It shows bullish positioning, although traders still appear cautious with size.
Liquidation data showed pressure on longs over 24 hours. Total liquidations reached $537.86K.
Long liquidations were $493.11K, while short liquidations were $44.74K. XRP’s next move now depends on the triangle breakout.
A move above $1.5954 could support a push toward $1.78. A break below $1.35 could trigger another wave of forced selling.
The post XRP Triangle Tightens as Traders Watch for a Fast Breakout Move Ahead appeared first on Live Bitcoin News.


You May Also Like
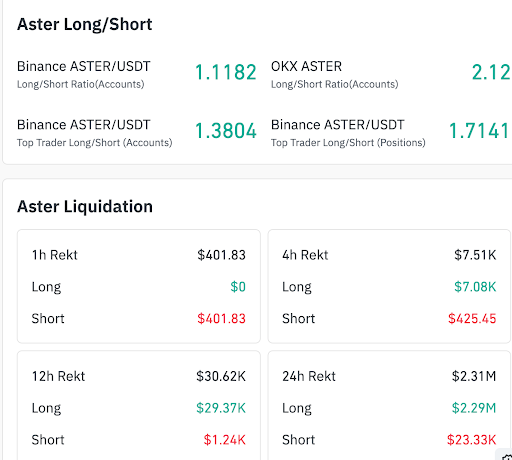
ASTER Whale Moves 34M Tokens to Aster as Price Slides and Losses Deepen Sharply

Vodacom Tanzania Modernises M-Pesa With $28m Infrastructure Upgrade


