Ethereum (ETH) Price Analysis: Accumulation Signals Flash Despite 50% Decline
Key Takeaways
- Ethereum has corrected approximately 50% from its October 2025 peak of $4,700 to current levels around $2,300, yet accumulation patterns suggest institutional buying
- The taker buy/sell ratio climbed to levels not seen since January 2023, indicating strong demand pressure
- Network activity shows smart contract deployments hit an all-time high on a 180-day moving average basis
- Spot Ethereum ETFs recorded $155 million in net inflows last week, marking the third consecutive week of positive flows
- Critical price zones: $2,400 represents overhead resistance while $2,200 serves as downside support
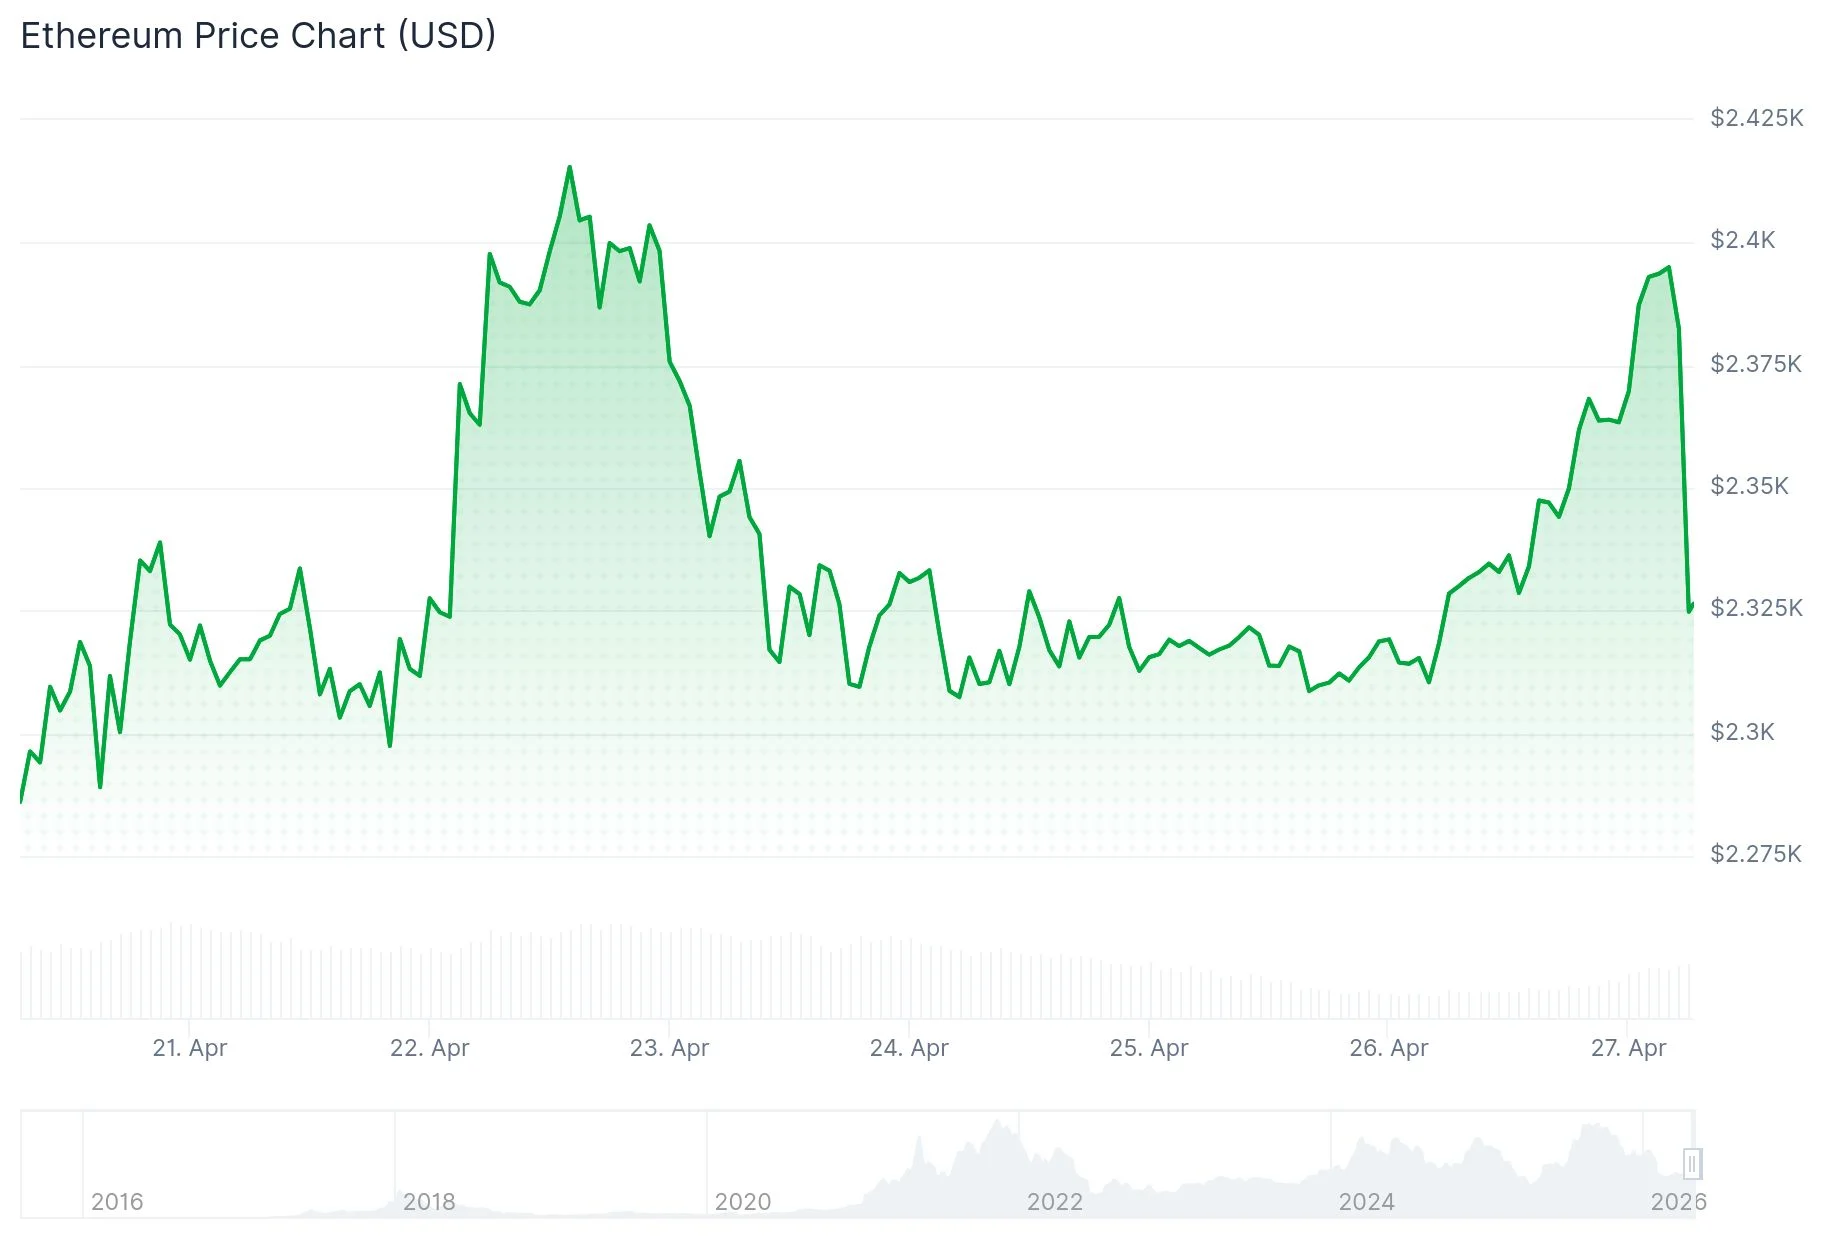
Ethereum’s price has experienced a significant downturn, shedding approximately half its value from the October 2025 peak near $4,700 to trade around $2,300 today. However, beneath the surface volatility, blockchain metrics reveal a different narrative—one of strategic accumulation.
 Ethereum (ETH) Price
According to metrics from CryptoQuant, the 30-day moving average of the taker buy/sell ratio has climbed to its most elevated reading since the beginning of 2023. This indicator measures the intensity of market orders on the buy side relative to sell-side pressure.
The data suggests that market participants are aggressively acquiring ETH even as downward price momentum persists. Such patterns typically indicate sophisticated investors methodically building positions during periods of market weakness.
Network Growth Contradicts Price Weakness
Additional analysis from CryptoQuant reveals that the 180-day moving average for newly deployed smart contracts has reached an unprecedented peak. This demonstrates that developer engagement continues to expand despite bearish price action.
Historical patterns show that surges in smart contract deployment activity have frequently foreshadowed price reversals. The current disconnect between robust network utilization and suppressed token valuation indicates that fundamental strength may not yet be reflected in market pricing.
According to SoSoValue data reported by Odaily, Ethereum spot exchange-traded funds attracted $155 million in net new capital during the week spanning April 20–24. This represents the third consecutive week of positive institutional flows.
BlackRock’s ETHA dominated inflows with $138 million for the period, pushing its cumulative net inflow to $11.97 billion. BlackRock’s ETHB contributed an additional $60.9 million. Conversely, Grayscale’s ETHE experienced the largest outflow at $49.2 million. Combined net assets across all Ethereum spot ETF products currently total $13.79 billion.
Market analyst Ted (@TedPillows) observed that ETH remains range-bound and cautioned that the collapse of US-Iran peace negotiations could introduce heightened volatility in the coming days. He highlighted that a successful reclaim of $2,400 could unlock the $2,470–$2,500 liquidity region, whereas a breakdown below $2,300 might trigger a retest of the $2,150–$2,200 zone.
Technical Outlook and Critical Zones
Examining the hourly timeframe, Ethereum successfully breached a descending triangle formation with resistance positioned at $2,320. The rally extended to $2,404 before entering a consolidation phase. Currently, ETH maintains its position above both $2,370 and the 100-hour simple moving average.
The nearest resistance barrier stands at $2,400, followed by $2,420 and $2,450. A decisive break above $2,450 could catalyze momentum toward $2,500 and potentially extend to the $2,550–$2,565 range.
For downside protection, $2,330 represents the initial support level. Below that threshold, $2,285 and $2,200 emerge as critical defensive zones.
In a notable development, Bitmine Immersion Technologies, linked to market strategist Tom Lee, disclosed plans to purchase 10,000 ETH directly from the Ethereum Foundation through an over-the-counter transaction valued at $23.9 million. This acquisition would elevate the firm’s total Ethereum holdings to 4.98 million ETH.
The post Ethereum (ETH) Price Analysis: Accumulation Signals Flash Despite 50% Decline appeared first on Blockonomi.


You May Also Like

USD/JPY Breakout Risk Looms on Potential Bank of Japan Surprise – ING Warns

Soccer Finally Won Over America but the 2026 World Cup May Leave Fans Behind