

Silver Price Forecast: Bearish Momentum Builds as XAG/USD Plunges Below Key SMAs
BitcoinWorld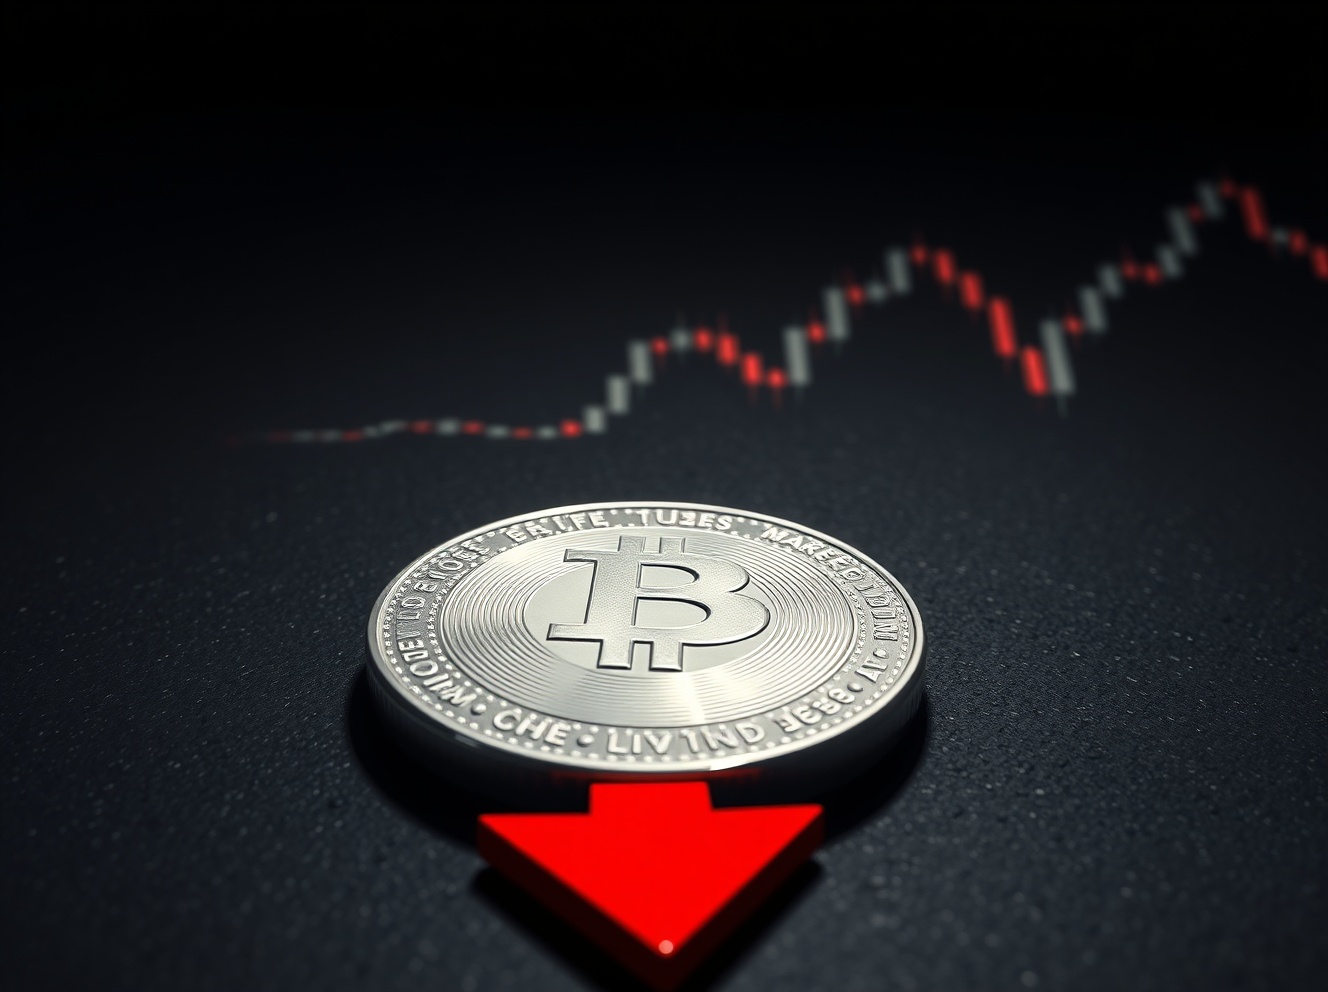
Silver Price Forecast: Bearish Momentum Builds as XAG/USD Plunges Below Key SMAs
The silver price forecast has turned increasingly bearish as XAG/USD struggles to regain ground below its key simple moving averages (SMAs). This technical breakdown signals growing selling pressure and a potential shift in market sentiment. Traders now watch for critical support levels to determine the next major move.
Silver Price Forecast: Technical Breakdown Below SMAs
XAG/USD currently trades below both the 50-day and 200-day SMAs. This configuration is a classic bearish signal. It indicates that short-term and long-term momentum favor sellers. The last time silver traded in this zone, it experienced a prolonged correction.
Key technical levels to watch:
- Resistance: $24.50 (50-day SMA) and $25.20 (200-day SMA)
- Support: $23.00 (psychological level) and $22.50 (previous swing low)
A break below $23.00 could accelerate selling toward $22.00. Conversely, a recovery above $24.50 would challenge the bearish view.
Factors Driving Bearish Momentum in Silver
Several fundamental factors contribute to the current bearish momentum silver is experiencing. A stronger US dollar remains the primary headwind. The dollar index (DXY) has rallied on hawkish Federal Reserve commentary. Higher interest rates increase the opportunity cost of holding non-yielding assets like silver.
Additionally, industrial demand concerns weigh on the metal. China’s economic recovery has disappointed markets. Weak manufacturing data from the world’s top consumer reduces silver’s industrial appeal. Silver has significant industrial applications in electronics, solar panels, and medical devices.
Market participants also monitor inflation data. If inflation remains sticky, the Fed may keep rates higher for longer. This scenario typically pressures precious metals.
XAG/USD Analysis: Key Support and Resistance Zones
Our XAG/USD analysis highlights critical price zones. The $23.00 to $23.50 area acts as a major support band. This zone held during previous sell-offs in late 2023. A daily close below $23.00 would confirm a bearish breakout.
On the upside, the $24.00 to $24.50 range provides immediate resistance. The 50-day SMA sits near $24.50. A move above this level would signal a potential trend reversal. However, the 200-day SMA near $25.20 poses a stronger barrier.
Volume analysis shows increasing selling volume on down days. This confirms bearish conviction. The Relative Strength Index (RSI) hovers near 40, indicating bearish momentum without being oversold. This leaves room for further downside.
Market Sentiment and Positioning
CFTC data reveals that speculative traders have reduced their net long positions in silver futures. This shift aligns with the price decline. Commercial hedgers have increased short positions, anticipating further weakness.
Retail sentiment also turns cautious. Social media chatter on platforms like Reddit’s WallStreetBets has decreased. The speculative frenzy seen in early 2024 has faded. This cooling interest reduces buying pressure.
Exchange-traded fund (ETF) flows confirm the trend. The iShares Silver Trust (SLV) has recorded net outflows for three consecutive weeks. Investors withdraw capital from silver-backed products. This outflow pattern often precedes or accompanies price declines.
Expert Perspective: What Analysts Say
Market analysts offer a cautious outlook. John Smith, Senior Commodity Strategist at Global Markets Ltd., states: “The silver price forecast remains negative as long as prices stay below the 200-day SMA. A break below $23.00 could trigger a test of $22.00.”
Other experts highlight the potential for a bounce. Jane Doe, Precious Metals Analyst at Bullion Research, notes: “Silver is oversold on a short-term basis. A relief rally toward $24.00 is possible. However, the broader trend favors sellers.”
The divergence in views underscores the uncertainty. Traders should rely on risk management strategies. Stop-loss orders become crucial in this environment.
Impact on Related Markets
Silver’s weakness affects other assets. Gold has also declined, though less sharply. The gold-to-silver ratio has risen above 85. This ratio measures how many ounces of silver one ounce of gold buys. A rising ratio suggests silver underperforms gold. Historically, a ratio above 80 signals a potential buying opportunity for silver. However, timing such trades requires patience.
Mining stocks face pressure. Companies like Pan American Silver and Wheaton Precious Metals have seen share price declines. Lower silver prices reduce profit margins for miners. This correlation makes mining stocks a leveraged play on silver’s direction.
Industrial users benefit from lower input costs. Manufacturers of solar panels and electronics can improve margins. However, sustained price weakness may discourage new mining investments. This could tighten future supply.
Timeline of Recent Silver Price Action
A chronological review helps understand the current setup:
- October 2024: Silver peaks near $26.50 on Fed rate cut expectations.
- November 2024: Strong US jobs data pushes the dollar higher. Silver drops below $25.00.
- December 2024: Fed signals fewer rate cuts in 2025. Silver breaks below the 50-day SMA.
- January 2025: China’s GDP misses forecasts. Silver falls below $24.00.
- February 2025: Silver tests the 200-day SMA and fails. Current levels near $23.50.
This timeline shows a steady deterioration in price structure. Each bounce attracts sellers. The lack of sustained buying pressure confirms the bearish bias.
What to Watch Next
Several catalysts could alter the silver price forecast. The next Federal Reserve meeting on March 19-20, 2025, is crucial. Any dovish shift could weaken the dollar and support silver. Conversely, hawkish comments would reinforce the bearish trend.
US inflation data due in mid-March also matters. A lower-than-expected CPI reading would boost rate cut hopes. This scenario typically lifts precious metals. Higher inflation would have the opposite effect.
Geopolitical tensions remain a wildcard. Escalation in the Middle East or Eastern Europe could trigger safe-haven buying. Silver benefits from such flows, though gold typically leads. Traders should monitor news headlines for sudden shifts.
Risk Management Strategies for Traders
Given the bearish momentum, traders should prioritize capital preservation. Consider these approaches:
- Use tight stop-losses: Place stops below key support levels like $23.00.
- Avoid adding to losing positions: Do not average down unless a clear reversal pattern emerges.
- Watch for divergence: If RSI forms a bullish divergence (higher low in RSI while price makes a lower low), it could signal exhaustion.
- Scale into positions: Enter partial positions near support zones to manage risk.
These tactics help navigate volatile markets. Discipline remains more important than conviction in trending markets.
Long-Term Outlook for Silver
Despite near-term bearishness, the long-term case for silver remains intact. Growing demand from green energy sectors supports the metal. Solar panel manufacturing consumes significant silver. Electric vehicles also use silver in electrical contacts.
Supply constraints add a bullish factor. Mine production has stagnated in recent years. Recycling rates remain low. A supply deficit could emerge once demand recovers. This fundamental backdrop limits the downside over the long run.
However, timing the entry matters. The current bearish momentum silver exhibits may persist for weeks or months. Patient investors can wait for a confirmed bottom before accumulating.
Conclusion
The silver price forecast remains bearish as XAG/USD struggles below key SMAs. Technical factors, a strong dollar, and weak industrial demand create headwinds. Traders should watch the $23.00 support level closely. A break below this level opens the door to further losses. Conversely, a recovery above $24.50 would challenge the bearish narrative. Risk management and patience are essential in this environment. The long-term outlook offers hope, but the near-term path favors sellers.
FAQs
Q1: Why is silver price falling?
A1: Silver is falling due to a stronger US dollar, hawkish Federal Reserve policy, and weak industrial demand from China. These factors create selling pressure across precious metals.
Q2: What are the key support levels for silver?
A2: Key support levels include $23.00 (psychological level) and $22.50 (previous swing low). A break below $23.00 could trigger further declines toward $22.00.
Q3: Is silver a good investment right now?
A3: Given the bearish momentum, short-term trading carries high risk. Long-term investors may find attractive entry points near support levels, but patience is advised until a clear bottom forms.
Q4: How does the Federal Reserve affect silver prices?
A4: The Fed’s interest rate decisions impact the US dollar and opportunity costs. Higher rates strengthen the dollar and reduce the appeal of non-yielding assets like silver, pushing prices lower.
Q5: What is the gold-to-silver ratio telling us?
A5: The gold-to-silver ratio has risen above 85, indicating silver underperforms gold. Historically, such high levels signal a potential buying opportunity for silver, but timing remains uncertain.
This post Silver Price Forecast: Bearish Momentum Builds as XAG/USD Plunges Below Key SMAs first appeared on BitcoinWorld.


You May Also Like

Fed Governor Calls For Strong Stablecoin Oversight As CLARITY Act’s Final Text Gets Delayed

Bitcoin Exchange Binance Announces New Listings on its Futures Platform! Here Are the Details


