Bitcoin Price Prediction: BTC Faces $79.4K Wall as Institutions Load Up
Key Insights:
- Bitcoin price prediction shows BTC testing $79.4K resistance after repeated failures.
- Whales and Morgan Stanley added 1,337.7 BTC worth about $104.85 million.
- Spot Bitcoin ETF inflows jumped to $629.7 million as U.S. demand returned.
Bitcoin price prediction entered focus in late April 2026 as BTC retested the $79,400 resistance zone after several failed breakout attempts. The move occurred across global crypto markets, with Bitcoin holding above $70,000 while institutional demand began recovering.
Data from ETF flows, whale accumulation, and Coinbase premium metrics pointed to renewed buying interest. The setup mattered because sustained demand now directly challenged a level that has capped price action for weeks.
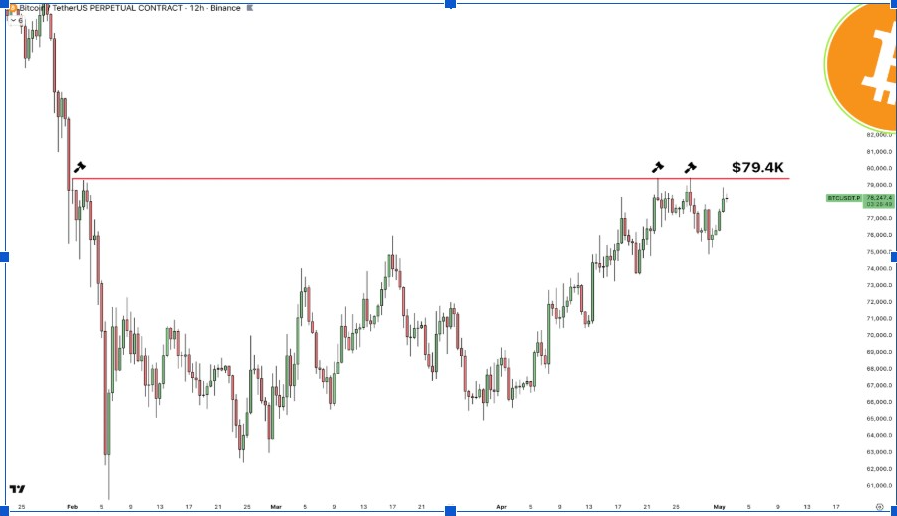
Bitcoin Price Prediction: $79.4K Remains Critical Barrier
Bitcoin price continued pressing against the $79,400 resistance level, which has rejected price multiple times in recent sessions. According to , repeated failures on the 12-hour timeframe confirmed this zone as the immediate ceiling bulls must reclaim. At the time of analysis, BTC traded near $78,247, just below resistance.
This level carried weight because each rejection slowed upward momentum despite the formation of higher lows. Buyers maintained control during dips, but sellers consistently absorbed demand near the upper boundary. This created a compression structure where price tightened below resistance.
 BTCUSDT 12-H Chart | Source: Sjuul, X
A confirmed breakout above $79,400 would shift short-term structure in favor of buyers. That move opens a path toward $80,000 as the first psychological level, followed by $81,300 as the next resistance zone. However, another rejection keeps price inside the $78,000–$79,400 range, extending consolidation.
Whale Accumulation Strengthens the Setup
On-chain activity shows that larger holders are still building positions. Onchain Lens reported that a newly created wallet withdrew 1,051 BTC from Binance. The transaction was worth about $82.37 million.
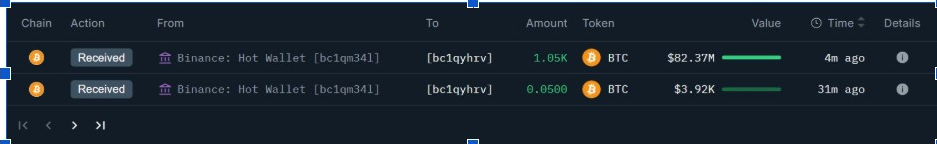 Newly Created Wallet Withdrew 1,051 BTC | Source: Onchain Lens
This type of movement often signals long-term holding intent. When Bitcoin leaves an exchange, it usually becomes less available for immediate selling. As a result, large withdrawals can reduce short-term supply pressure.
Bitcoin price has held above $70,000 for almost a month, and that stability is attracting stronger hands. Whales are treating the current range as a buying zone rather than an exit point.
Still, whale accumulation alone does not guarantee a breakout. Bitcoin must still clear the resistance that has capped recent rallies. Without stronger follow-through, the $79,400 level may remain a short-term ceiling.
Morgan Stanley Adds BTC as U.S. Demand Returns
Furthermore, institutional demand is also improving. Arkham data showed that Morgan Stanley purchased another 286.7 BTC worth about $22.48 million. This raised the firm’s holdings to 2,620 BTC, valued at nearly $204.7 million.
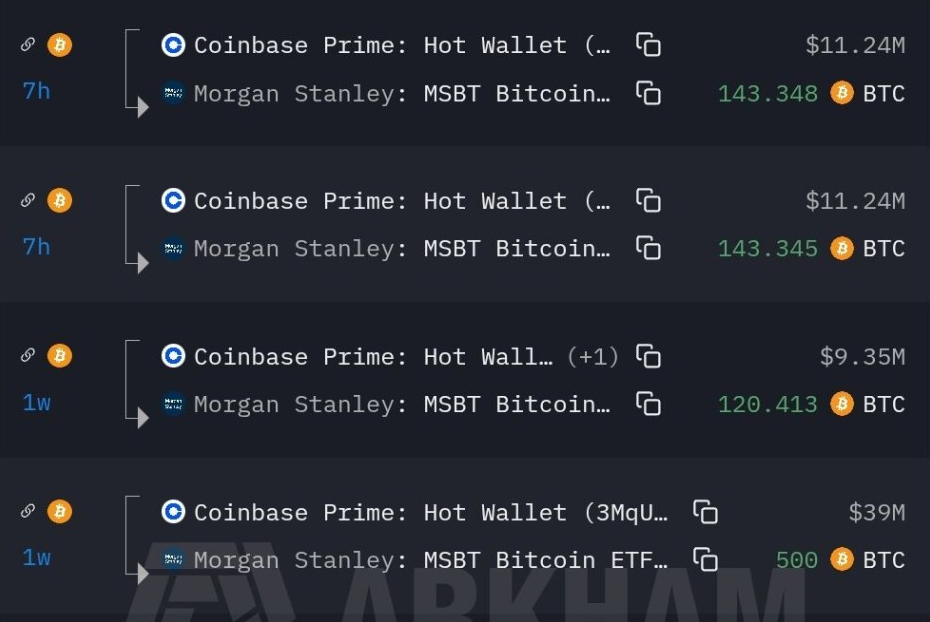 Morgan Stanley Adds BTC | Source: Arkham Data
Together, the new whale wallet and Morgan Stanley added 1,337.7 BTC worth about $104.85 million. This accumulation adds weight to the bullish case, as it shows that large buyers are still active near resistance.
Meanwhile, U.S. investor demand has started to recover. The Coinbase Premium Index turned positive after four straight days in negative territory. At press time, the metric stood near 0.003, while the premium gap was around 2.9.
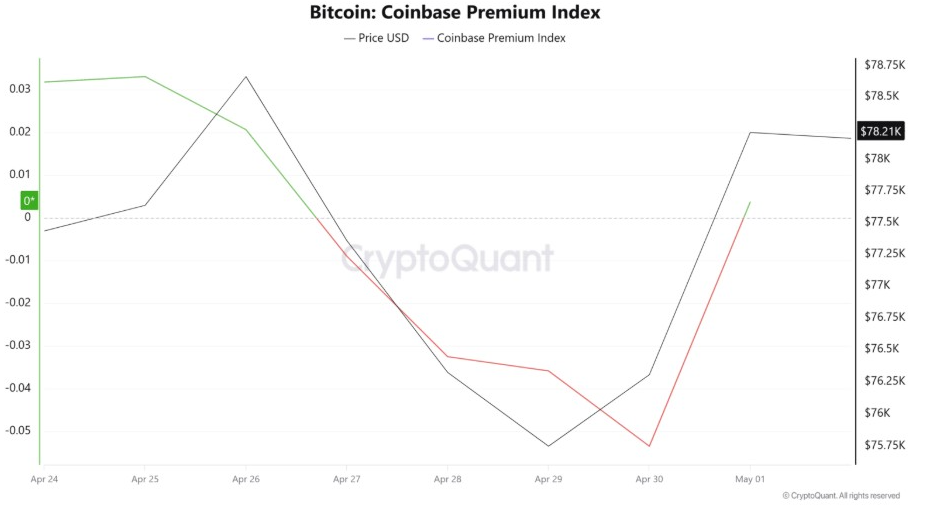 Bitcoin Coinbase Premium Index | Source: CryptoQuant Data
Spot Bitcoin ETF flows also support the shift in sentiment. SoSoValue data showed net inflows rising to $629.7 million. This marked an increase of more than $600 million from the previous day.
Technical Structure Shows Strength Without Breakout Confirmation
Bitcoin price maintained an ascending channel for nearly a month, with consistent higher lows supporting the recovery structure. Buyers continued stepping in during pullbacks, reinforcing demand at lower levels. This pattern indicated controlled upward pressure rather than aggressive breakout momentum.
Momentum indicators showed gradual improvement. The Relative Strength Index (RSI) moved from 53 to 60, entering a stronger bullish range. However, the reading remained below overbought conditions, indicating that momentum had room to expand but lacked confirmation.
At the same time, resistance near $79,400 remained intact, preventing trend continuation. This created a divergence between improving momentum and capped price action. Such setups often resolve with a decisive move once either buyers or sellers gain control.
The Future Grand Trend Indicator projected a potential move toward $81,300 if resistance breaks. After that, it suggested a cooling phase toward $78,000, indicating possible consolidation before the next leg.
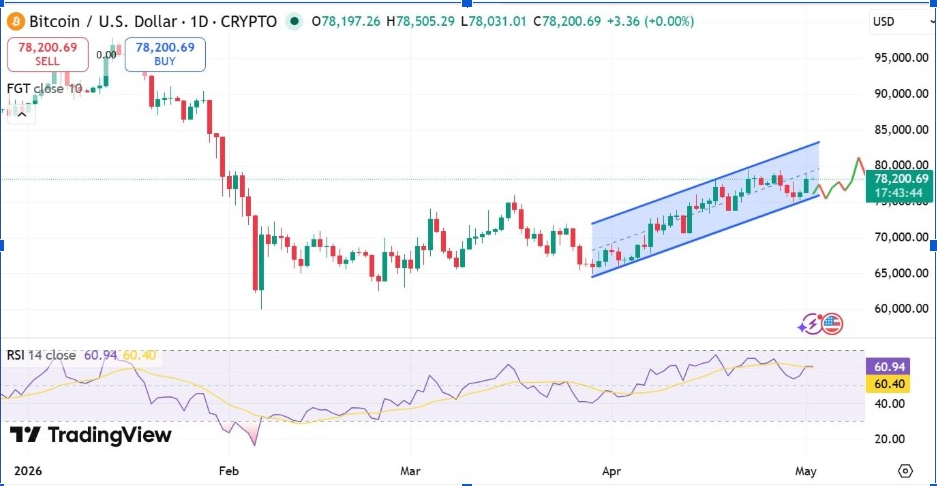 BTCUSD Daily Chart | Source: TradingView
Bitcoin price now trades at a compression point where ETF inflows, whale accumulation, and resistance pressure converge. A clean break above $79,400 confirms continuation toward $80,000 and $81,300, while another rejection keeps price rotating toward $78,000 as sellers test whether demand can sustain the current structure.
The post Bitcoin Price Prediction: BTC Faces $79.4K Wall as Institutions Load Up appeared first on The Market Periodical.


You May Also Like

Lava Network Partners with Bitcore to Advance Regulated Digital Finance

REGULATION | a16z Backs the CFTC Against States Trying to Ban Prediction Markets