XRP (XRP) Price: Historic Chart Formation Returns With 66% Rally Potential
Key Takeaways
- XRP’s current chart structure mirrors a 2025 formation that delivered 66% returns, reaching $3.66
- Critical breakout level above $1.40 remains in focus as technical analysts monitor price development
- Daily chart symmetrical triangle formation suggests potential movement toward $1.90, followed by $2.00
- May 1 saw spot taker CVD turn positive, signaling renewed buyer dominance in the market
- Derivatives data shows open interest delta surged to +$27 million on May 1, indicating fresh positioning
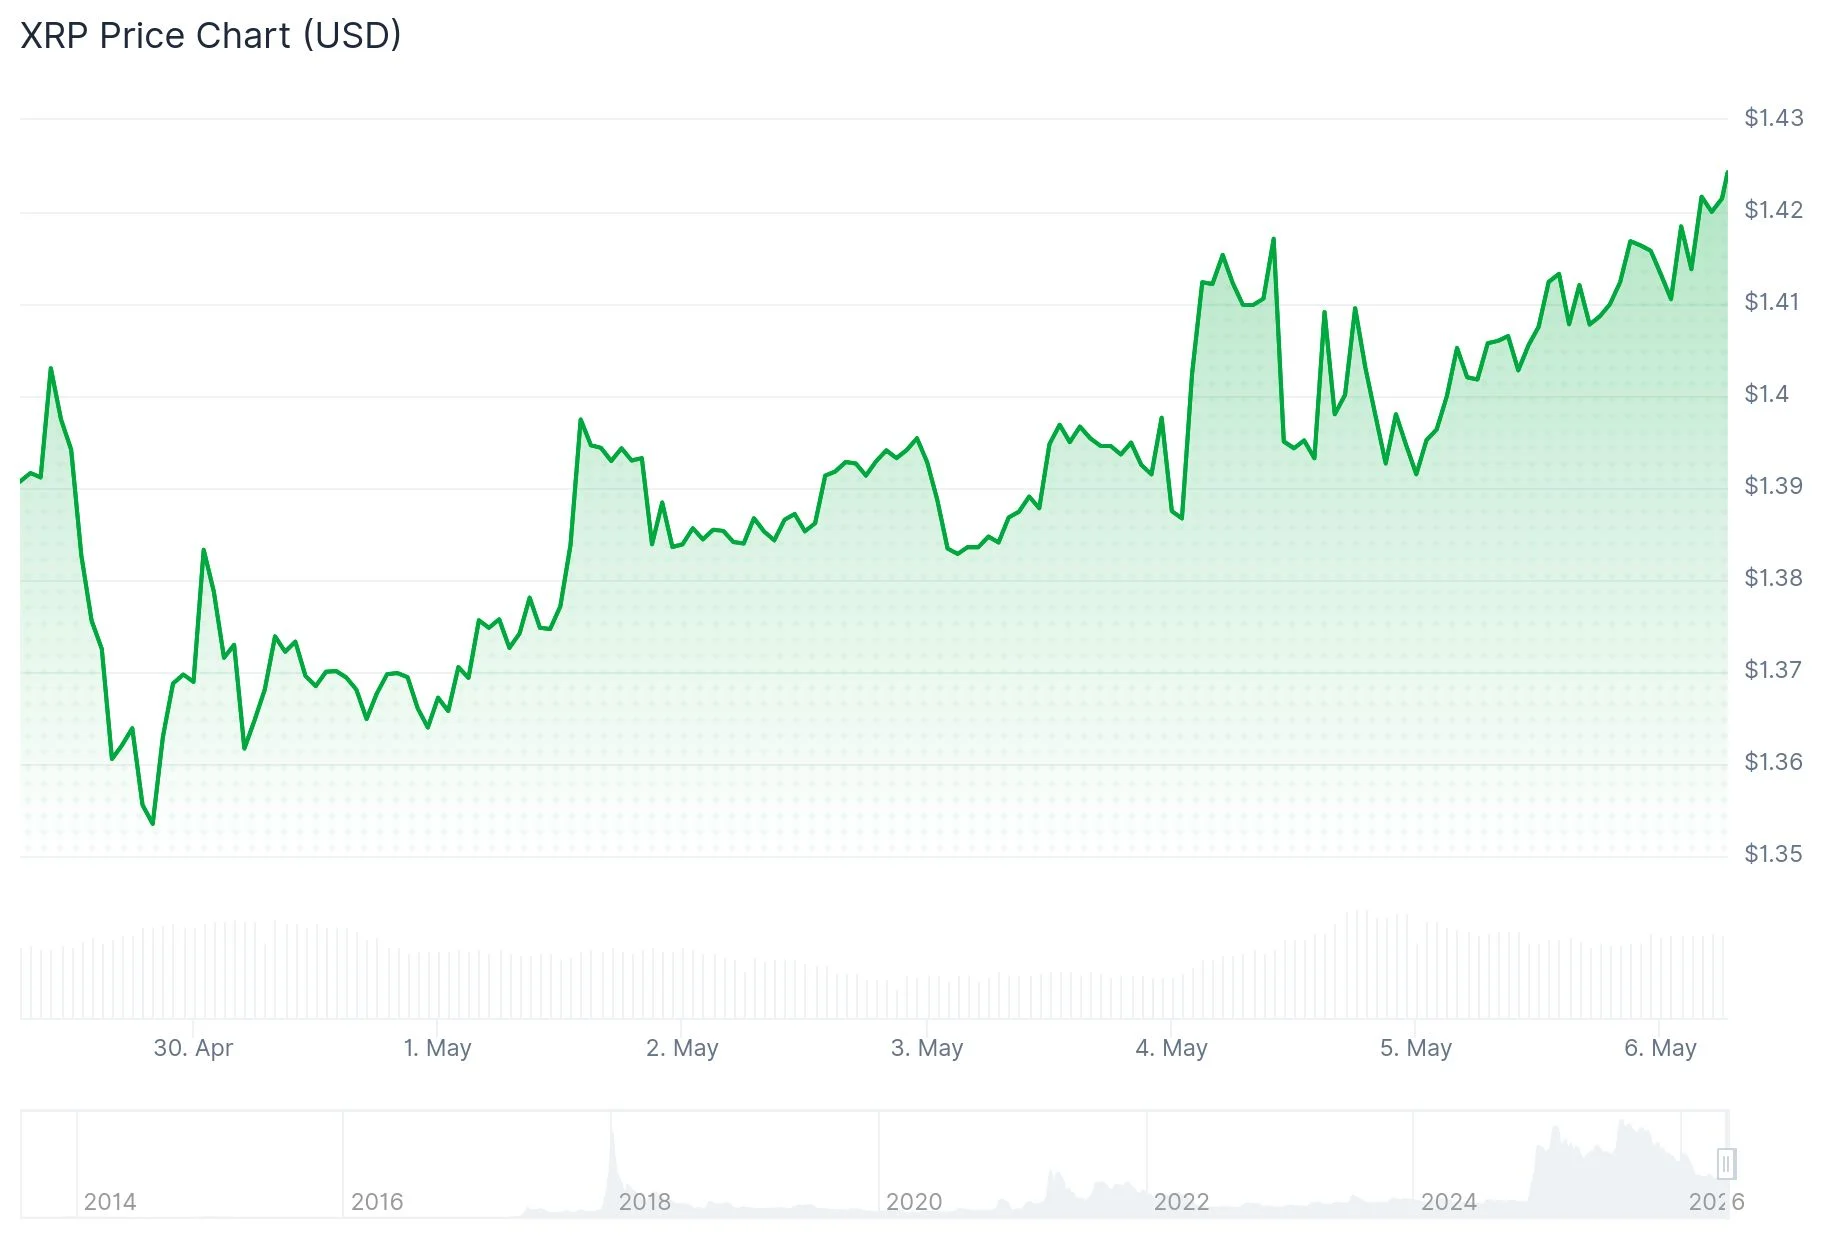
As of early May 2026, XRP is hovering between $1.39 and $1.41, maintaining a consolidation phase following its recent test of near-term resistance levels. Technical analysts are increasingly focused on striking parallels between current price behavior and a formation that materialized in mid-2025.
 XRP Price
The 2025 configuration — characterized by a bull flag structure combined with a bullish exponential moving average crossover — catalyzed a powerful 66% advance within a fortnight, propelling XRP from approximately $2.21 to its peak of $3.66.
The current technical landscape appears to be replicating that earlier template. XRP has successfully cleared a comparable bull flag formation, while the 20-day and 50-day exponential moving averages are approaching a potentially bullish intersection.
Should the 66% fractal pattern repeat from present price levels, a projection toward approximately $2.35 becomes mathematically viable.
Market Depth Data Confirms Buyer Resurgence
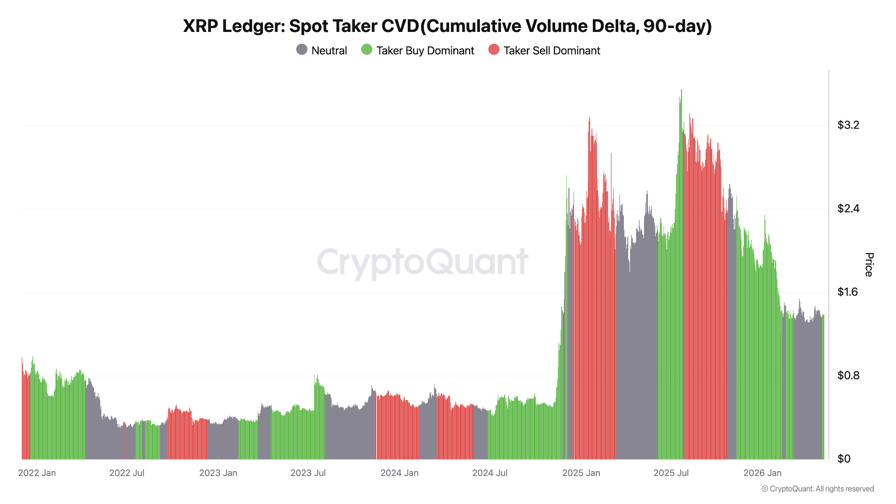
Among the most compelling evidence supporting the bullish thesis is XRP’s 90-day spot taker cumulative volume delta (CVD). This indicator calculates the net difference between aggressive buying and selling volume across a three-month window.
 Source: CryptoQuant
The metric transitioned into positive territory on May 1, coinciding precisely with XRP‘s penetration above the $1.38 resistance threshold. A comparable CVD transition occurred in June 2025, which subsequently preceded a 70% price appreciation.
CryptoQuant analyst Amr Taha drew attention to a pronounced positive spike in open interest delta, which registered $27 million on May 1. “When this metric elevates concurrent with ascending prices, it typically indicates traders are expanding their exposure as bullish momentum initiates its return,” Taha explained.
Converging Triangle Formation Suggests $1.90 Objective
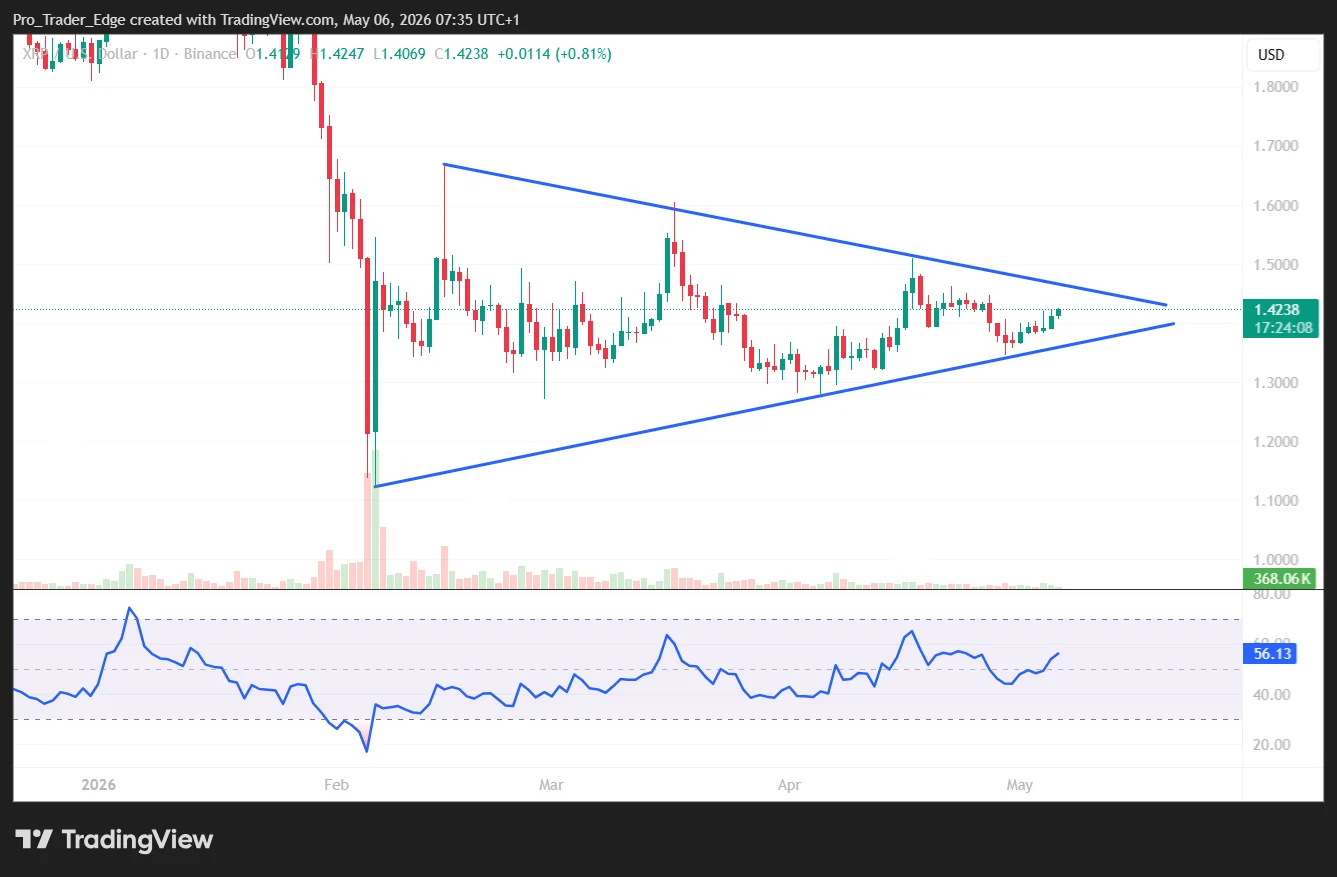
On the daily timeframe, an additional symmetrical triangle configuration is taking shape. This technical structure features two converging trendlines that constrain price movement until a decisive breakout materializes.
 Source: TradingView
A sustained advance beyond $1.45 would authenticate this pattern and establish a measured move objective near $1.90 — calculated by projecting the triangle’s vertical height. Subsequently, the $2.00 psychological barrier represents the following technical milestone.
Momentum oscillators are aligning favorably as well. The Supertrend indicator has transitioned to green, confirming a directional shift. The MACD is approaching a bullish crossover point, which, upon confirmation, would provide additional technical validation for upward movement.
The critical requirement for maintaining setup validity is sustained support above $1.40 — representing both the bull flag’s upper boundary and the 50-day simple moving average.
The post XRP (XRP) Price: Historic Chart Formation Returns With 66% Rally Potential appeared first on Blockonomi.


You May Also Like

Ripple CEO Says CLARITY Act Is a Done Deal as Senate Prepares Markup

Tempus AI (TEM) Stock Drops 7% After Earnings — Here’s Why a Beat Wasn’t Enough