

BNB Accumulation Zone Sparks Bold Calls For A Move Toward 10000
BNB trades near $647 as the $678 resistance and $600 to $300 accumulation zone shape bold calls for a move toward $10000.
BNB traders are discussing a possible accumulation range between $600 and $300. The token recently traded near $647 after a sharp fall from its former high near $1,255.
Some market analysts now point to long-term targets of $2,000, $5,000, and $10,000, but the chart still shows key resistance before any wider recovery.
BNB Accumulation Range Comes Into Focus
BNB traders are watching the $600 to $300 zone as a possible long-term accumulation area.
The range has become part of a wider discussion because past BNB cycles saw strong gains after long pullbacks.
A social media post compared the current range with earlier BNB accumulation phases.
It cited a 660% move from the 2019 zone and an 11,200% move during 2020 to 2021. It also claimed the 2025 to 2026 phase has produced a 566% move so far.
The same post gave a long-term roadmap of $2,000, $5,000, and $10,000. It framed the setup as a long-term view rather than a short-term trade.
The post also included “NFA and DYOR,” which means not financial advice and do your own research.
The $10,000 target remains a bold market call. It would need strong demand, wider crypto growth, and a clear shift in price structure.
For now, traders are watching whether BNB can hold its lower support zones.
BNB Price Tests Key Fibonacci Resistance
BNB is trading around $647 on the daily chart. The price sits below the 0.786 Fibonacci retracement level at $678.35.
This level has become the main resistance area for short-term buyers.
The $678 to $680 zone is important because price has already reacted near it. A daily close above this area could show stronger buyer control.
It could also open a move toward $801, which is the 0.618 Fibonacci level.
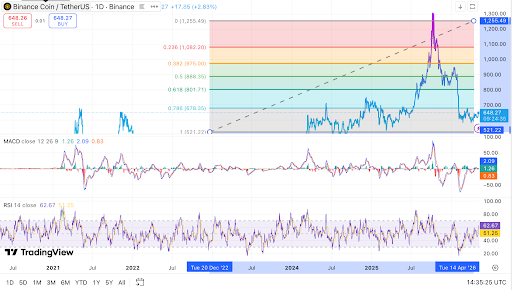 BNB trades near $648 below key Fibonacci resistance, Source TradingView.
The next major level above $801 is near $888. That area matches the 0.5 Fibonacci retracement.
A move into that range would require steady volume and support from the wider crypto market.
On the downside, BNB has support between $600 and $620. Price has built a base near that zone in recent sessions.
If that support fails, traders may watch the $521 level as the next major downside area.
Read Also:
MACD And RSI Show Early Recovery Signs
BNB momentum indicators show early signs of recovery. The MACD line is above the signal line, and the histogram has moved into positive territory.
This shows that short-term momentum has improved. Still, the signal does not confirm a full trend change.
The price must reclaim the $678 to $680 zone for stronger confirmation. Without that move, BNB may remain stuck between $600 and $680.
The RSI is near 62, which shows improving strength. It is also below the overbought zone. That gives the token room to move higher, but resistance still remains close.
A break above $678 could place $801 and $888 back in focus. A rejection could keep BNB inside its current range, while $600 and $521 remain important support levels.
The post BNB Accumulation Zone Sparks Bold Calls For A Move Toward 10000 appeared first on Live Bitcoin News.


You May Also Like

UNI Price Prediction: $3.80 Target Within 10 Days as Whales Stack Against Retail Euphoria

MATIC Price Prediction: Dead Cat Bounce Exhaustion Signals 65% Crash to $0.13 by June


