

BTC/USDT Spot CVD Chart Analysis: May 9 Order Book Insights
BitcoinWorld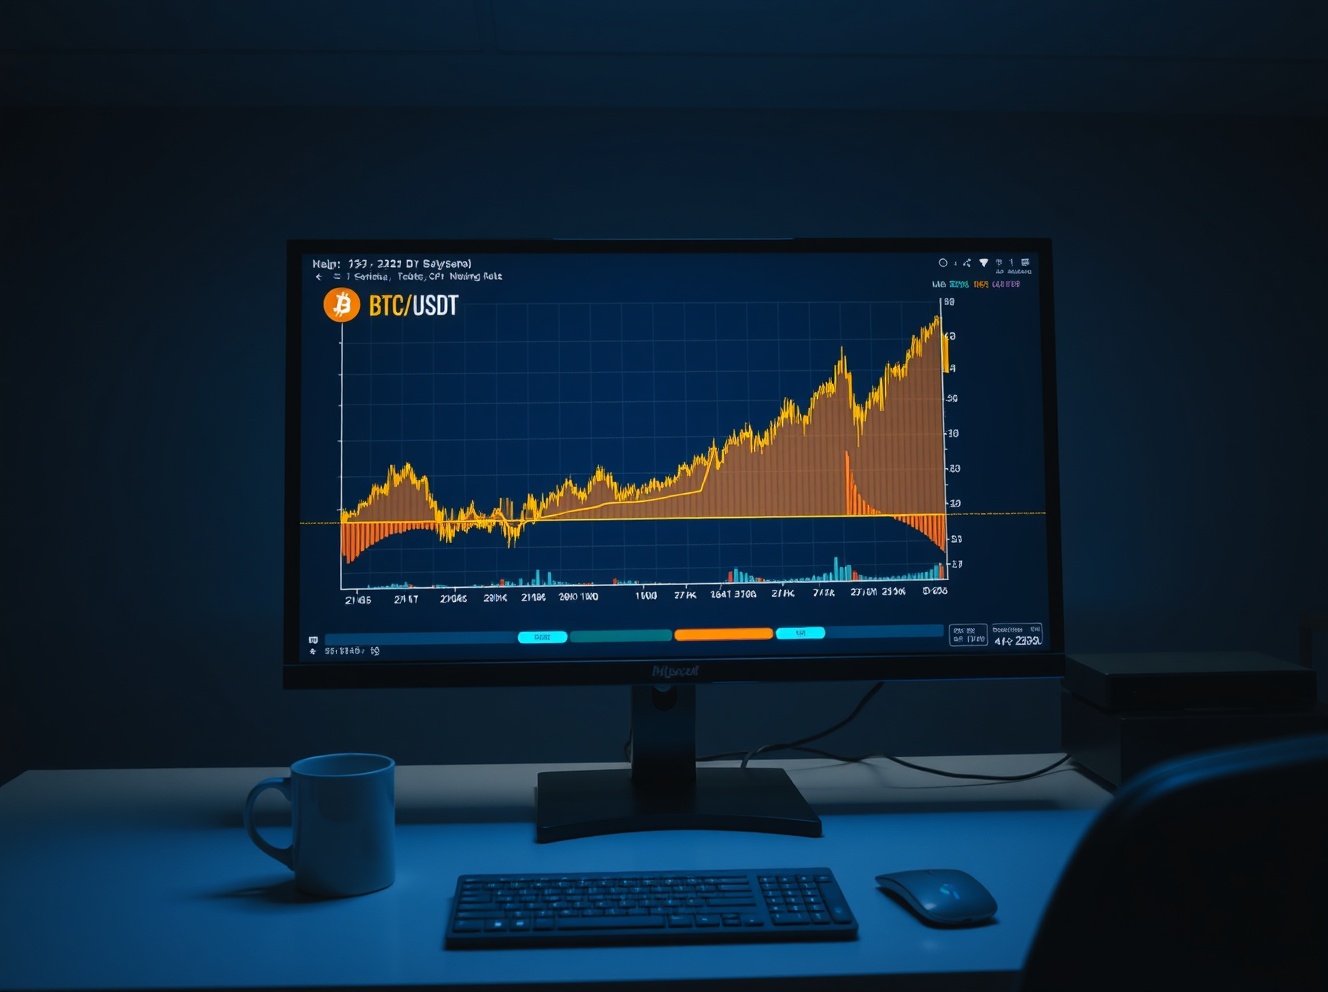
BTC/USDT Spot CVD Chart Analysis: May 9 Order Book Insights
On May 9, the BTC/USDT spot Cumulative Volume Delta (CVD) chart provided traders with a detailed view of order book dynamics during early Asian trading hours. The analysis, based on data recorded at 5:00 a.m. UTC, combines two key visual tools: the Volume Heatmap and the Cumulative Volume Delta indicator.
Understanding the Volume Heatmap
The top section of the chart displays a Volume Heatmap, which tracks the concentration of trading activity at specific price levels. When the price remains within a certain range for an extended period or experiences significant movement, the background color becomes brighter. These brighter zones can indicate potential support or resistance levels, as they represent areas where a large number of trades have occurred, suggesting heightened interest from buyers or sellers.
Cumulative Volume Delta (CVD) Indicator
The lower section of the chart presents the Cumulative Volume Delta, a metric that categorizes buy and sell orders by trade size. As buy orders increase, the corresponding colored line rises. The chart distinguishes between different order sizes: the yellow line represents orders between $100 and $1,000, while the brown line tracks large orders ranging from $1 million to $10 million. This granularity helps traders identify whether retail or institutional activity is driving price movements.
Implications for Bitcoin Traders
For traders monitoring the BTC/USDT pair, the CVD chart offers a real-time snapshot of market sentiment. A rising CVD line, particularly in the large order category, may signal strong buying pressure from whales or institutional participants. Conversely, a declining CVD could indicate selling pressure. The Volume Heatmap complements this by highlighting price levels where significant liquidity exists, which can serve as decision points for entry or exit strategies.
Context and Relevance
This type of analysis is particularly valuable during low-liquidity periods, such as early morning UTC hours, when order book imbalances can lead to sharper price swings. By combining heatmap data with CVD trends, traders can better assess the strength behind price movements and adjust their strategies accordingly. The May 9 snapshot reflects typical early-session conditions, with no major macroeconomic events driving unusual activity at that time.
Conclusion
The BTC/USDT spot CVD chart from May 9 provides a clear, data-driven view of order book behavior, offering actionable insights for traders focused on Bitcoin’s short-term price dynamics. Understanding the interplay between volume concentration and cumulative delta remains a cornerstone of effective technical analysis in cryptocurrency markets.
FAQs
Q1: What does the Cumulative Volume Delta (CVD) indicator show?
The CVD indicator tracks the net difference between buy and sell orders over time, categorized by trade size. A rising line indicates more buying volume, while a falling line suggests selling pressure.
Q2: How is the Volume Heatmap useful for trading?
The Volume Heatmap highlights price levels where high trading activity has occurred. Brighter areas can act as support or resistance zones, helping traders identify potential reversal points.
Q3: Why are large orders ($1M-$10M) significant in the CVD chart?
Large orders often represent institutional or whale activity. Their impact on the CVD line can signal major shifts in market sentiment, as these trades can move the market more than smaller retail orders.
This post BTC/USDT Spot CVD Chart Analysis: May 9 Order Book Insights first appeared on BitcoinWorld.


You May Also Like

Judges block Republicans’ bid to dismantle Grand Canyon national monument

Nabox Wallet Integrates ShareX ($SHARE) – Revolutionizing the Web3 Sharing Economy via BNB Chain


