XRP Sits at the Apex: Triangle Pattern and Resistance Meet
XRP hits its symmetrical triangle apex as resistance holds and Stoch RSI turns overbought. The next move toward $1.60 or lower is coming fast.
The price spiked above resistance. Then it came right back down. That happened on Wednesday. XRP briefly cleared the descending resistance line that has capped the token since February, then pulled back inside the range within hours.
According to ChartNerdTA on X, the token “continues to toy with us during this oscillation,” noting the daily Stochastic RSI has now flipped overbought while volume stays relatively thin.
The chart in that post shows the symmetrical triangle at its apex, which the XRP triangle compression has been building toward since February, with both trendlines nearly touching. Descending resistance presses from above. Ascending support rises from below. The gray circle on the apex lands at the end of May.
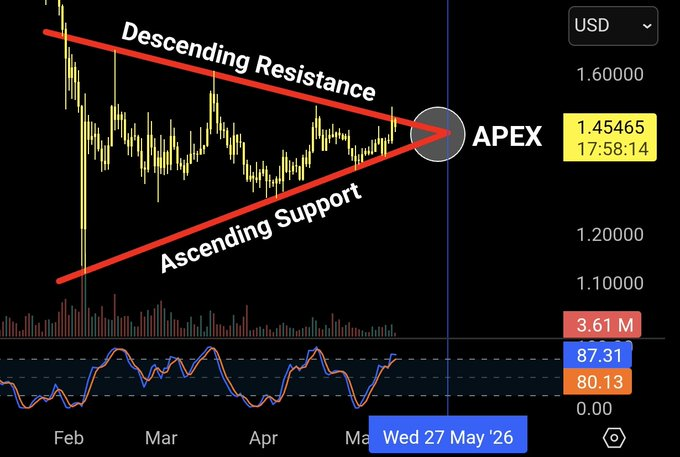
Source: ChartNerdTA
Resistance Keeps Rejecting. The Stoch RSI Disagrees.
The daily momentum reading flipping overbought at this exact convergence point is not a clean signal either way. Price sits at $1.45 area. The resistance band runs between $1.48 and $1.52 on most reads.
ChartNerdTA issued a caution with the post. If the move toward $1.60 or $1.80 unfolds, “be cautious,” the account said on X. Not a bearish call. A reminder that overbought readings inside resistance can resolve sharply in either direction.
The Elliott Wave read from MCOGlobalES adds a different layer. According to MCOGlobalES on X, Ripple is “following the plan,” describing the current price action as a corrective rally into the resistance zone, exactly as anticipated. Not a breakout. A bounce into supply.
Two Reads. One Price Level.
The weekly chart attached to that analysis is worth slowing down on. Wave labels show a B-wave recovery attempt off the wave A low near $1.22. The C-wave projection, should the corrective structure hold, lands somewhere between $0.98 and $0.48 on the Fibonacci extension grid. That gold zone sits well below where XRP trades today.
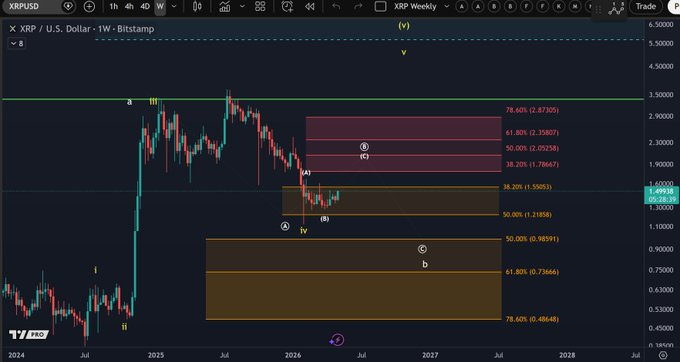
The Fibonacci grid from the XRP weekly resistance zones places $1.52 as the nearest key level. Above it, $1.78 and $1.91 become the next conversation. The 50% retracement off the macro high sits at $2.02.
But none of that matters until something closes above $1.52 with volume. Low volume moves inside compression zones tend to whipsaw. ChartNerdTA flagged this specifically, noting that volume remains the missing variable.
The symmetrical triangle has been compressing since February. Higher lows. Lower highs. Both lines converging at a point the chart now marks as current. That is not months away anymore.
MCOGlobalES called it a corrective rally. ChartNerdTA called it an oscillation. Both are watching the same resistance band. The market is at the apex, volume is thin, and the Stoch RSI is overbought.
Disclaimer: This article is based purely on technical analysis from cited sources. It does not constitute financial or investment advice.
The post XRP Sits at the Apex: Triangle Pattern and Resistance Meet appeared first on Live Bitcoin News.


You May Also Like

SHIB and Pi Move Sideways, BlockDAG Takes the Market Lead With a Live Casino and Utility Stack! Is It the Best Crypto to Buy Now?

Sui (SUI) Jumps 50% on Staking Surge and Stablecoin Plans