

AST SpaceMobile Stock turns constructive after a sharp earnings pop

AST SpaceMobile Stock is pivoting cautiously bullish after a post-earnings surge lifted price above key daily averages. Fundamentals improved despite headline misses, and the daily technical backdrop leans constructive. However, elevated volatility and short-term overextension argue for a staggered approach to risk.
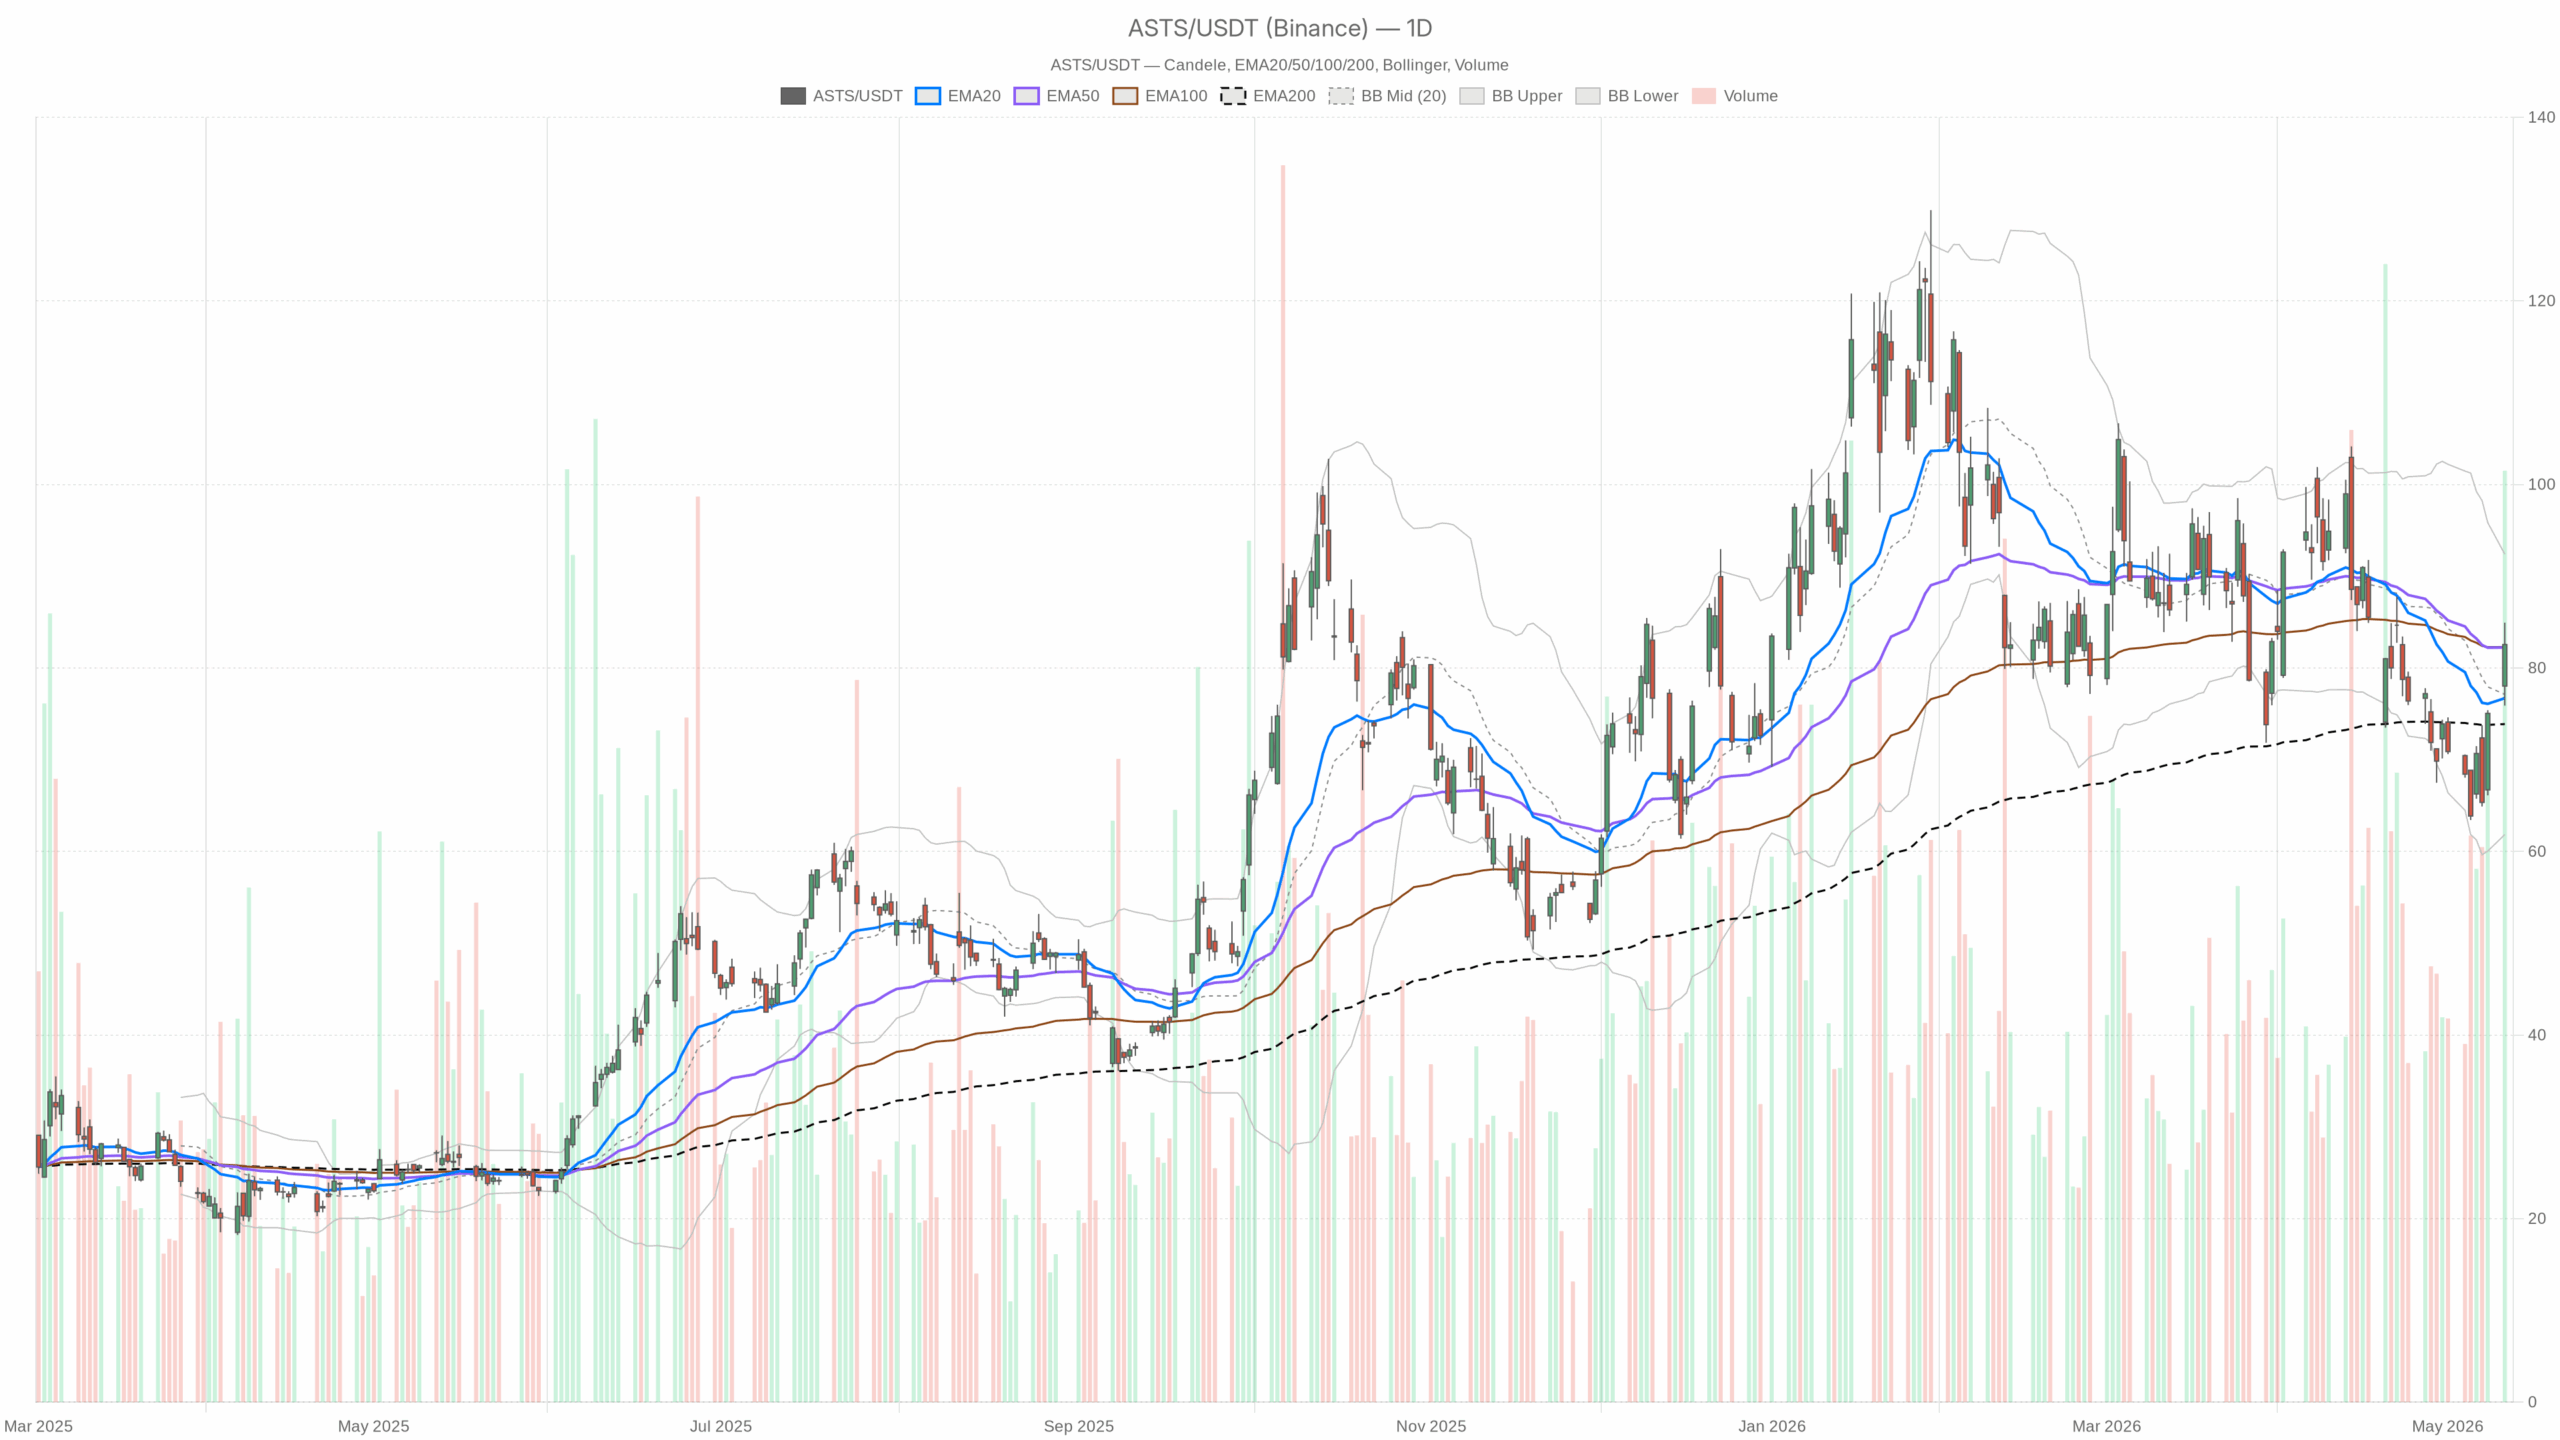 ASTS — daily chart with candlesticks, EMA20/EMA50 and volume.
AST SpaceMobile Stock news and catalysts
Notably, Q1 was framed as a classic “miss and rally.” Management reiterated $150–$200 million revenue guidance, targeted roughly 45 BlueBird satellites in orbit by end-2026, and highlighted FCC approval, a 98.9 Mbps test, and a June Falcon 9 launch window. The stock rose on these milestones despite missing Street forecasts. Investors prioritized commercialization visibility over near-term prints.
ASTS daily technical outlook
Price structure and trend bias
On the daily timeframe, ASTS closed at 82.55 after ranging 75.90–84.94, finishing near the upper end on strong turnover. The EMA20 76.71, EMA50 82.22, and EMA200 73.89 now sit below price. Therefore, the trend bias has turned constructive.
Meanwhile, RSI14 53.16 stands modestly above neutral, tilting positive. The MACD -4.01 versus signal -4.57 with a positive histogram of 0.56 shows momentum crossing up while still below the zero line—an early-cycle improvement rather than a mature trend.
Volatility context and key levels
The Bollinger mid sits at 77.12 with bands spanning 61.85–92.39; price is above the mid-band and riding the top half of the range with room before the upper band. However, ATR14 6.2 remains elevated, so daily swings are wide and position sizing matters.
The daily pivot is 81.13 with R1 86.36 and S1 77.32. Closing above the pivot supports buyers; therefore, R1 is the next logical upside test for AST SpaceMobile Stock.
Hourly trend: momentum strong, risk overbought
Structure and momentum
On the hourly chart, EMA20 76.54, EMA50 73.48, and EMA200 78.91 all sit below price at 82.54, confirming an intraday uptrend. However, RSI14 72.67 is overbought, so upside is strong but vulnerable to cooling. The MACD 4.00 versus signal 2.83 with a histogram of 1.17 keeps tactical momentum positive.
Volatility and pivots
The Bollinger mid is 73.98 with bands at 59.64–88.31; price trades near the upper band, tightening the margin for error. At the same time, ATR14 2.36 reflects brisk intraday ranges, so pullbacks can be fast.
The hourly pivot sits at 82.89 with R1 83.57 and S1 81.86. Price is just below the pivot; therefore, a quick reclaim of 82.89 would reassert control for buyers of AST SpaceMobile Stock.
15-minute execution layer: consolidation after the spike
On the 15-minute view, EMA20 82.46, EMA50 78.46, and EMA200 73.07 define a micro uptrend, with price only marginally above the 20-EMA. Meanwhile, RSI14 55.61 is mid-range as momentum cools to neutral.
The MACD 1.66 versus signal 2.20 with a histogram of -0.53 shows very short-term momentum rolling over. In addition, the Bollinger mid at 83.36 with bands 81.99–84.72 leaves price below the mid, signaling mean-reversion pressure. The pivot is 82.83 with R1 83.45 and S1 81.92; immediate resistance sits overhead.
Trading scenarios for AST SpaceMobile Stock
Therefore, the main scenario is cautiously bullish on the daily timeframe. The hourly confirms trend strength but flags overbought risk. The 15-minute view argues for patience on entries, favoring pullbacks into support rather than chasing highs.
Bullish scenario
Holding above the daily pivot at 81.13 and the daily EMA50 82.22 keeps the path pointed higher. A firm reclaim of the hourly pivot at 82.89 and a push through hourly R1 83.57 would validate momentum. That sequence opens a run toward daily R1 86.36 and, if participation persists, toward the daily upper Bollinger near 92.39 in extension.
Bearish scenario
On the other hand, a bearish rebuttal starts with failed reclaim attempts at 82.89 followed by a break back through 82.22 and 81.13. Losing those shelves hands initiative to sellers and risks a slide toward daily S1 77.32 and the daily EMA20 76.71. The daily MACD remains below zero, so the bullish case is early and can be invalidated by swift risk-off flows.
Bottom line on AST SpaceMobile Stock
Overall, positioning into strength looks viable only with respect for volatility. The daily ATR 6.2 and the hourly overbought RSI increase whipsaw risk. At the same time, the improving news backdrop and constructive daily structure in ASTS favor buying dips rather than chasing breakouts while the market digests the post-earnings move.


You May Also Like

XYO Unveils AI SDK to Enable On-Chain ‘Vibe Coding’ Without Blockchain Skills

LIST: Bayanihan initiatives amid soaring oil prices


