

Bitcoin and gold actually have nothing to do with each other?
Source: The DeFi Report
Does Bitcoin Follow Gold?
Compiled and compiled by: BitpushNews

Year to date (YTD), gold is up 39%, while Bitcoin is up just 19%. The last time gold outperformed Bitcoin during a bull market was in 2020. In the first half of that year, gold rose 17%, while Bitcoin rose 27%.
What about the second half of 2020? Bitcoin surged 214%, while gold only rose 7%.
This begs the question: Are we at a similar stage today, with Bitcoin on the verge of a stunning outperformance?
This report delves into the relationship between Bitcoin and gold, revealing everything you need to know.
Disclaimer: The views expressed in this article are the author’s personal views and should not be considered investment advice.
Let's get started.
Correlation analysis
What drives the price of gold?
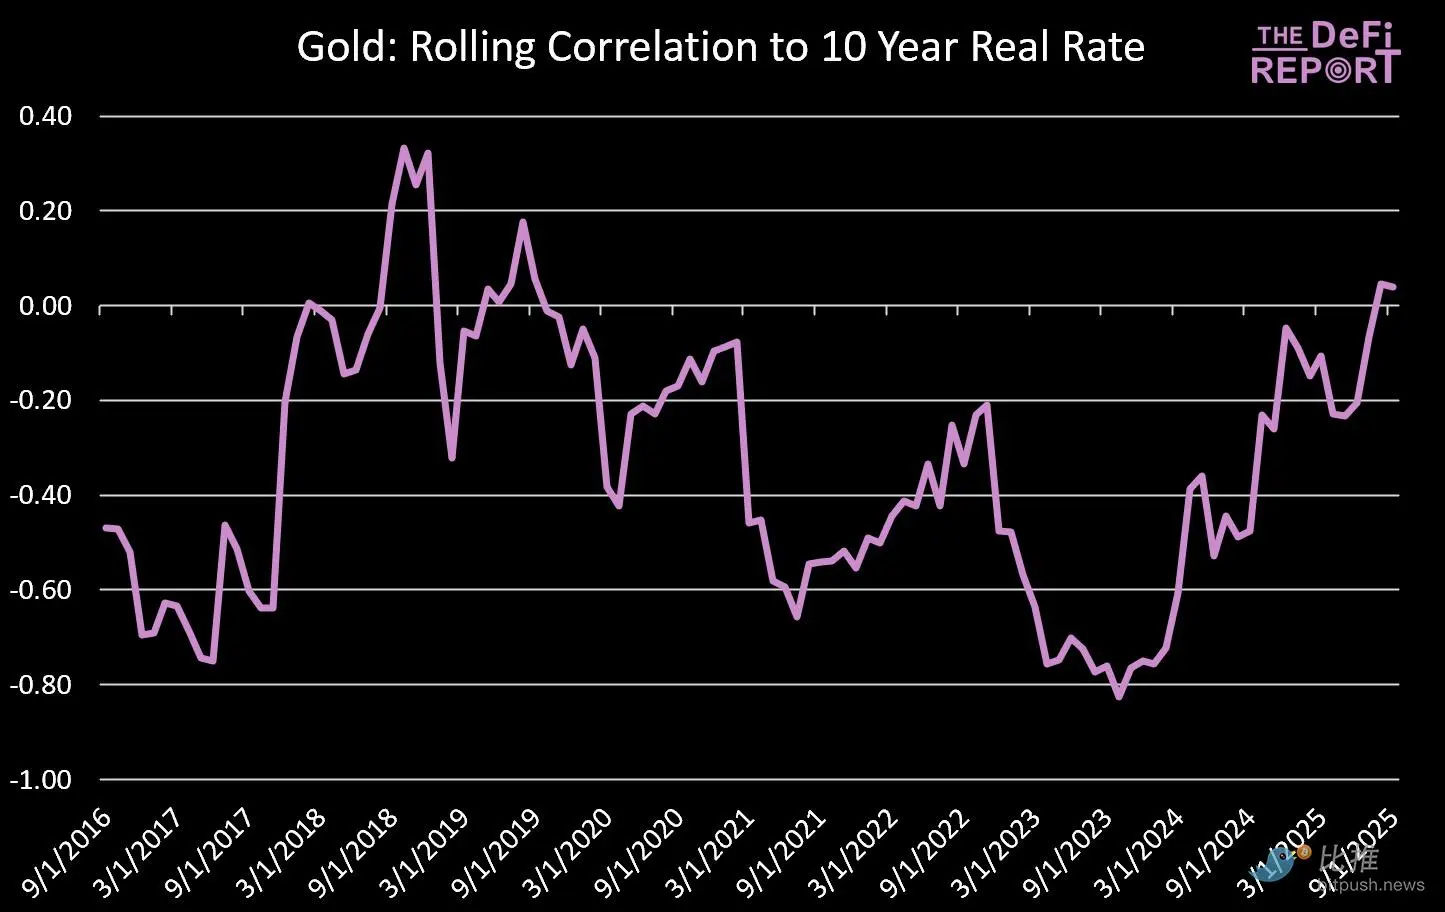
Gold and 10-year real interest rate data source: The DeFi Report
The chart above tells us that there is a negative correlation between the price of gold and real interest rates (based on the change in monthly returns and the change in the 10-year real interest rate).
In simple terms:
- Gold tends to outperform when real interest rates fall (nominal yields minus inflation shrink).
- When real interest rates rise (yields move higher relative to inflation), gold tends to struggle (because it doesn't itself produce a yield).
Nonetheless, the relationship has recently decoupled somewhat, with gold rising alongside real interest rates – a move likely triggered by the US kicking Russia out of the SWIFT system in February 2022.
Currently, the R² value is 0.156, which means that 15.6% of gold price movements over this period can be statistically explained by changes in real interest rates.
importance:
We are entering a period where real interest rates are likely to fall – a historically favorable setup for gold. For investors, this suggests that gold’s upward momentum is likely to continue as inflation expectations stabilize above 2% and nominal yields decline.
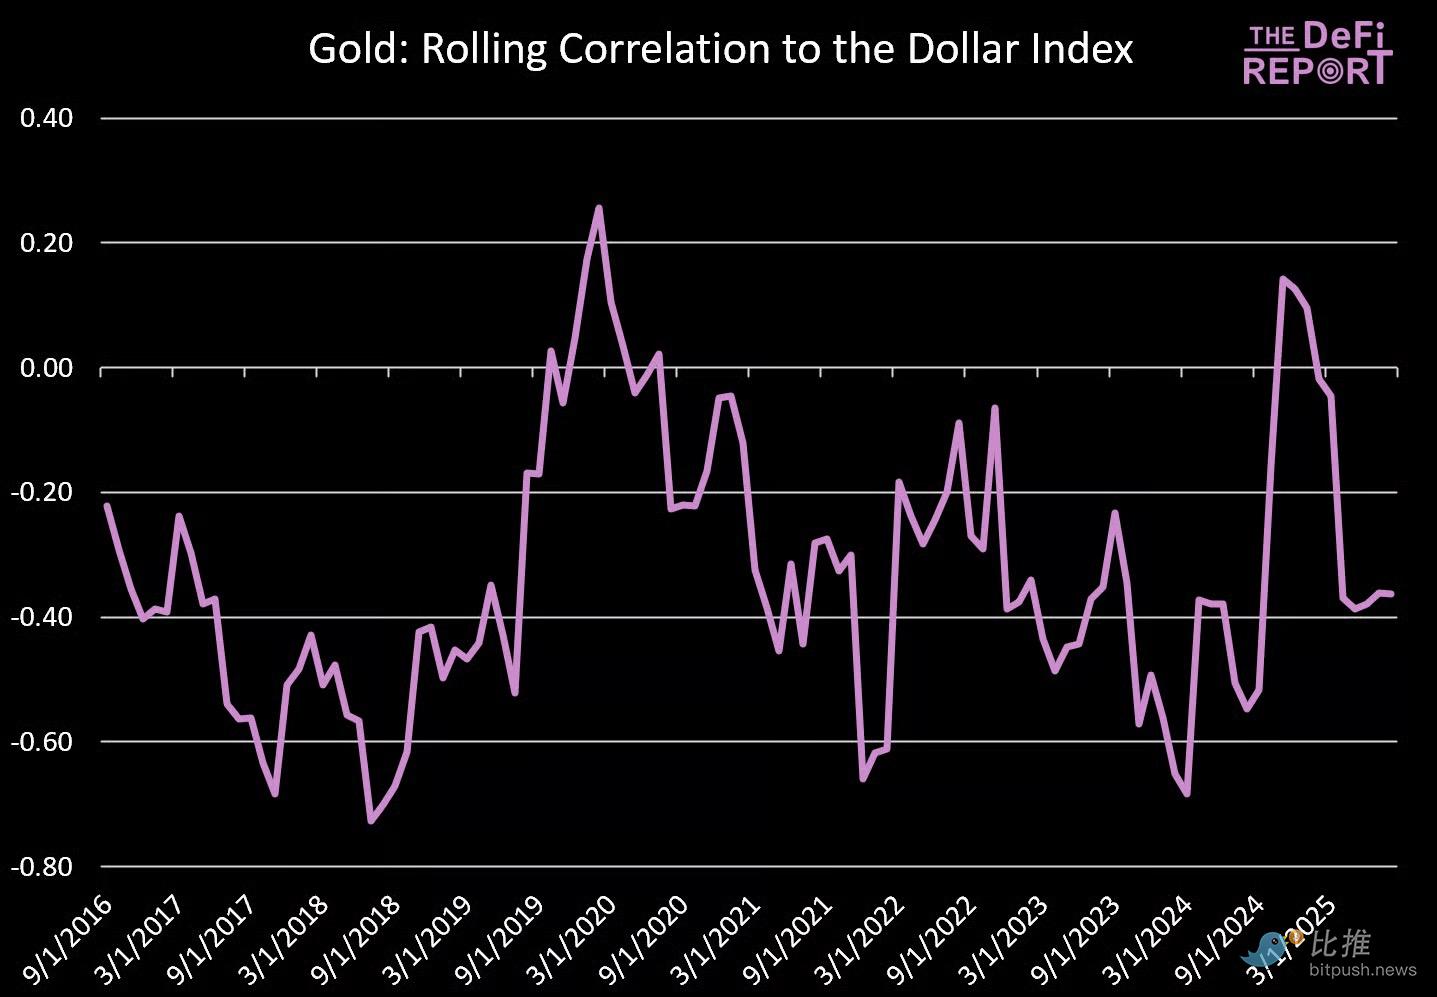
Gold and US Dollar Index data source: The DeFi Report, FRED
Similar to its relationship with real interest rates, gold has historically maintained a negative correlation with the US dollar index.
- When the dollar falls, gold tends to rise (which is the case currently).
- Gold typically comes under pressure when the dollar strengthens.
The R² value is 0.106, indicating that approximately 10.6% of gold price movements during this period can be statistically explained by fluctuations in the US dollar.
Bitcoin and 10-year real interest rates
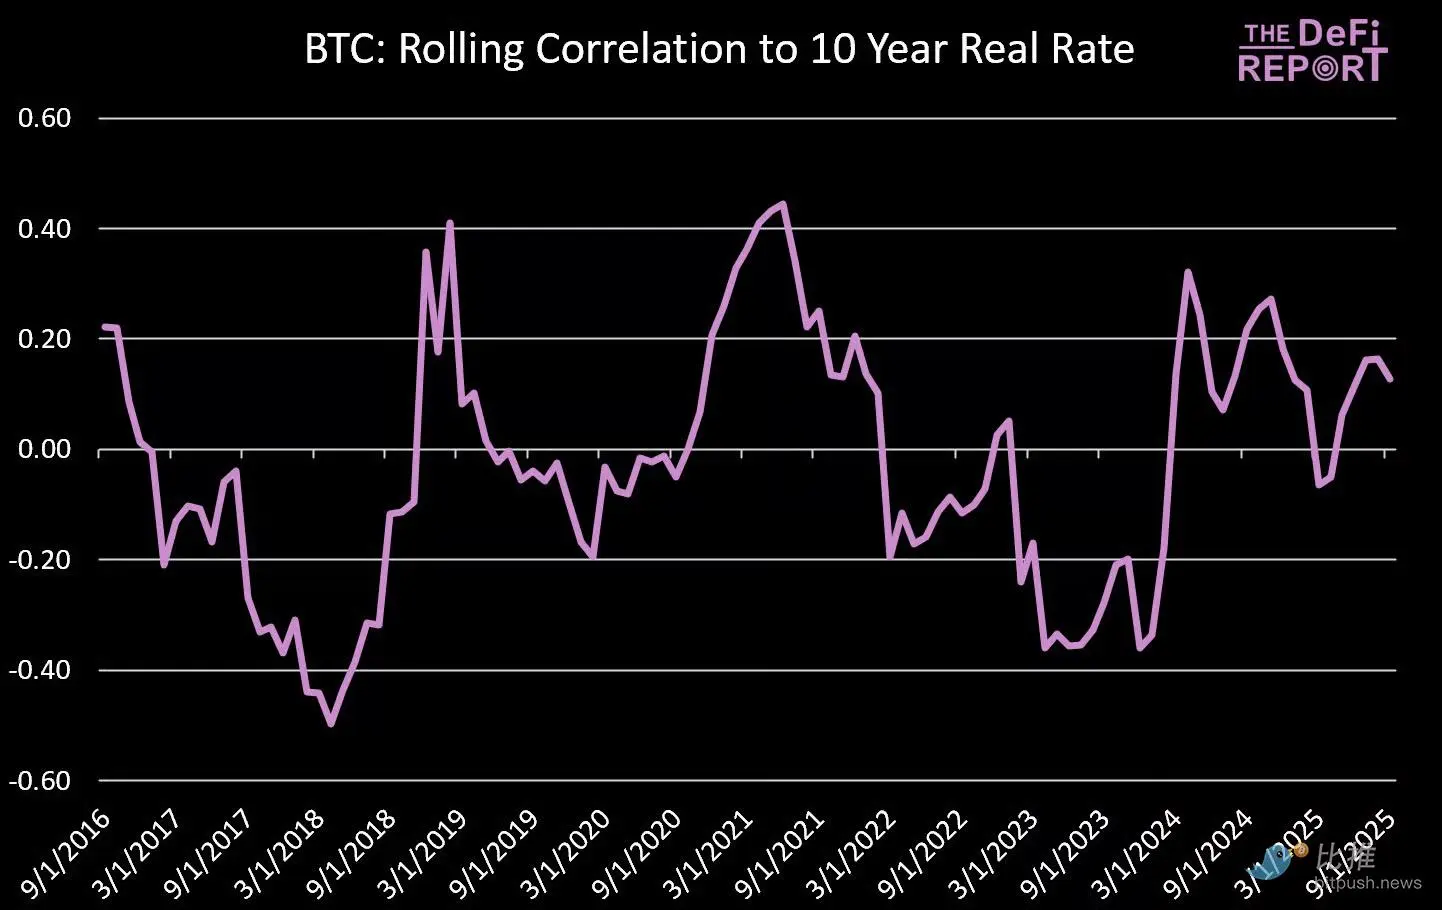
Data source: The DeFi Report, FRED
Unlike gold, there is no significant relationship between Bitcoin and 10-year real interest rates.
Sometimes, Bitcoin rises as real interest rates fall. Other times, the opposite happens. This inconsistency suggests that Bitcoin's price movements aren't driven by the same macroeconomic factors that influence gold.
This is confirmed by the R² value of 0.002 – real interest rates barely explain Bitcoin’s returns.
Bitcoin and the US Dollar Index
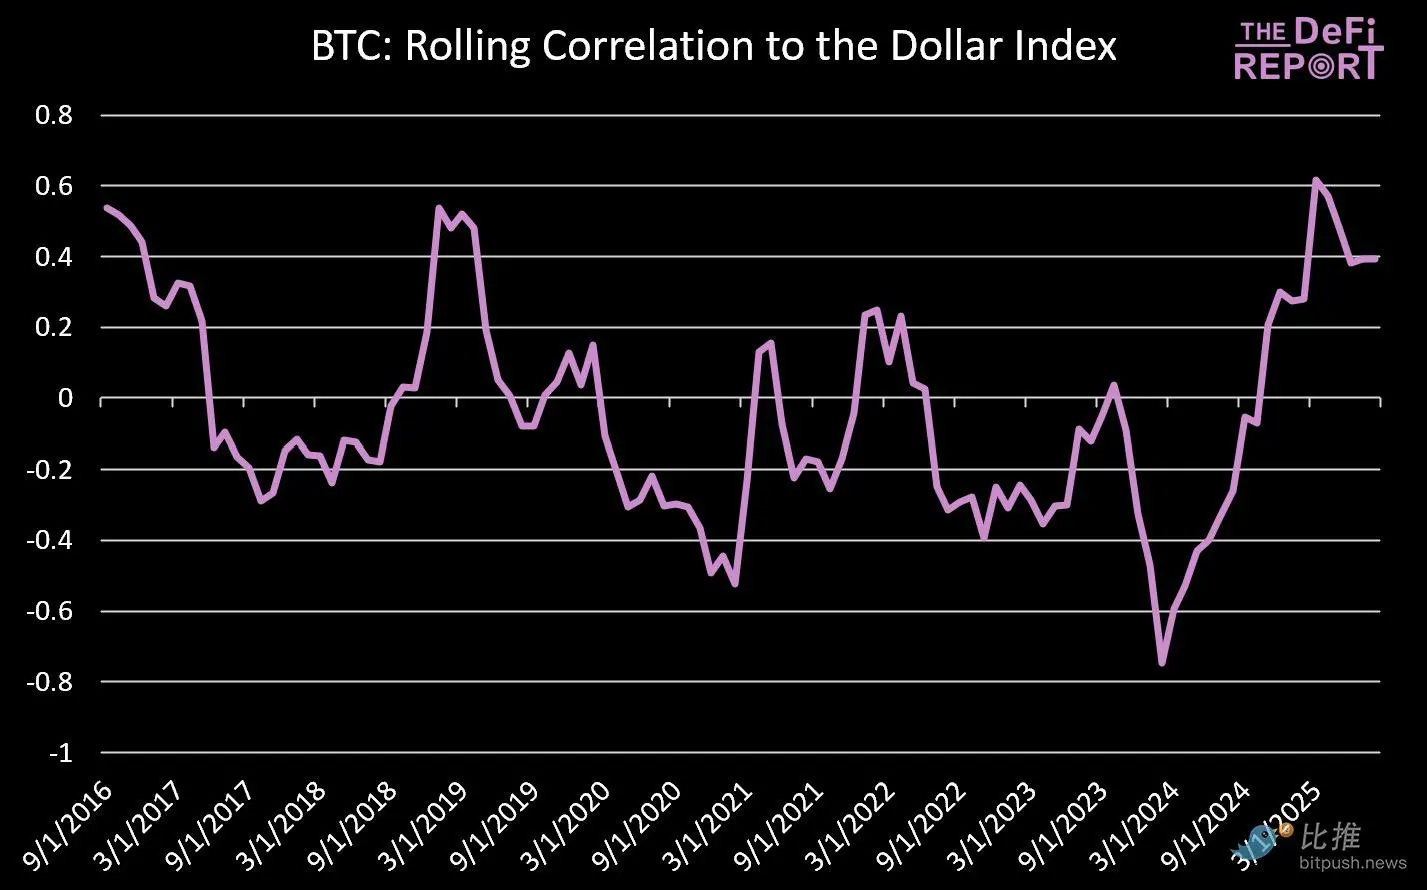
Data source: The DeFi Report, FRED
There is also no consistent relationship between Bitcoin’s price action and the US dollar index.
At times, Bitcoin has been negatively correlated with the US dollar (rising when the dollar weakens), while at other times, it has risen alongside the dollar. This inconsistency highlights that Bitcoin is not driven by the same monetary dynamics that affect gold.
An R² value of 0.011 reinforces this view – the US dollar only explains 1% of Bitcoin’s returns.
importance:
Unlike gold (which is often measured through the lens of the dollar’s strength), Bitcoin is driven by different factors: adoption cycles, liquidity flows, on-chain reflexivity, and other idiosyncratic factors/narratives.
Its lack of correlation with the US dollar further confirms that Bitcoin is becoming a unique asset class, not just a "digital version of gold."
Bitcoin and the Nasdaq
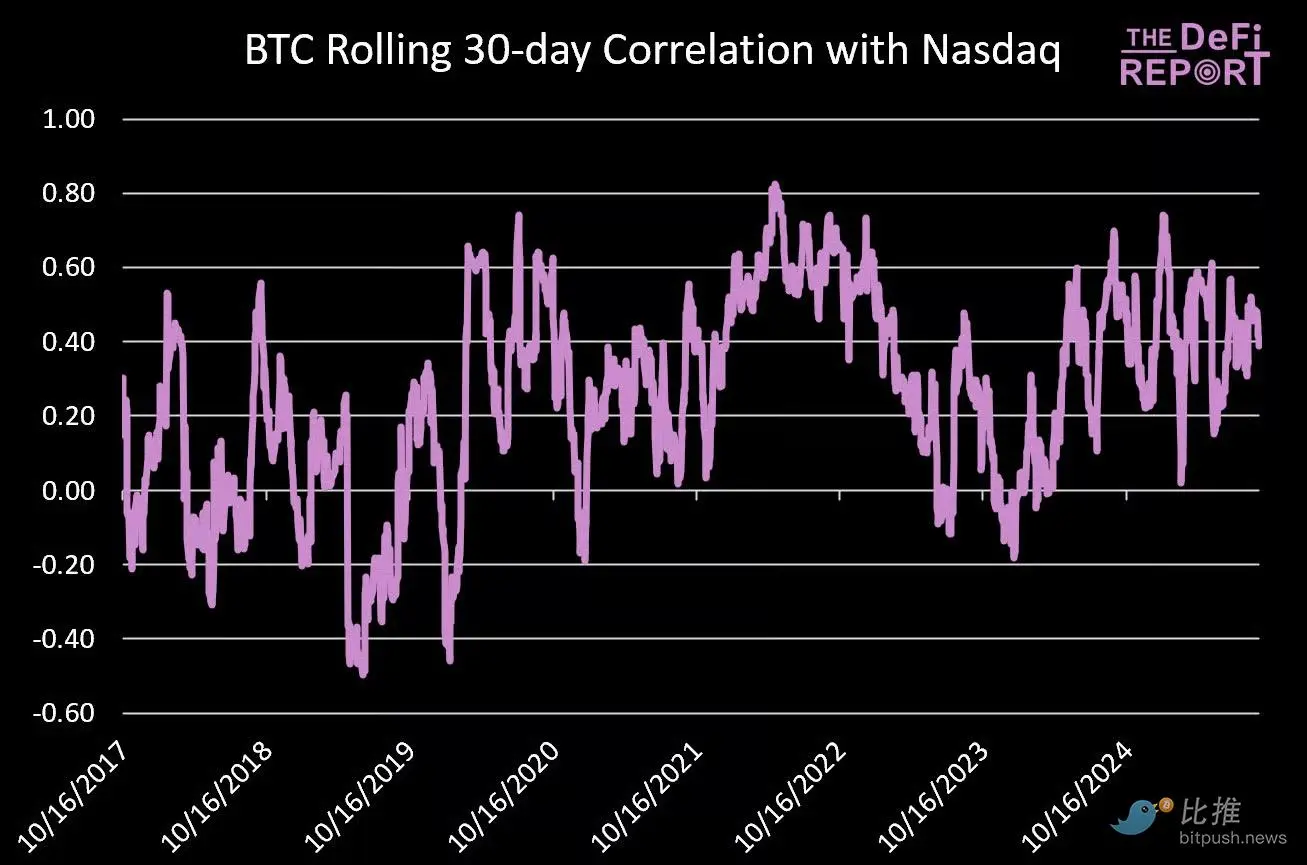
Data source: The DeFi Report
Bitcoin exhibits a stronger positive correlation with the Nasdaq than with macro drivers such as real interest rates or the US dollar.
This relationship has remained consistent since 2017, with an R² of 0.089, meaning that approximately 8.9% of Bitcoin’s price movements can be statistically explained by fluctuations in the Nasdaq.
By comparison, the R² between gold and the Nasdaq over the same period was just 0.006 – less than 1% of gold’s returns were correlated with the performance of tech stocks.
Bitcoin and Gold Correlation
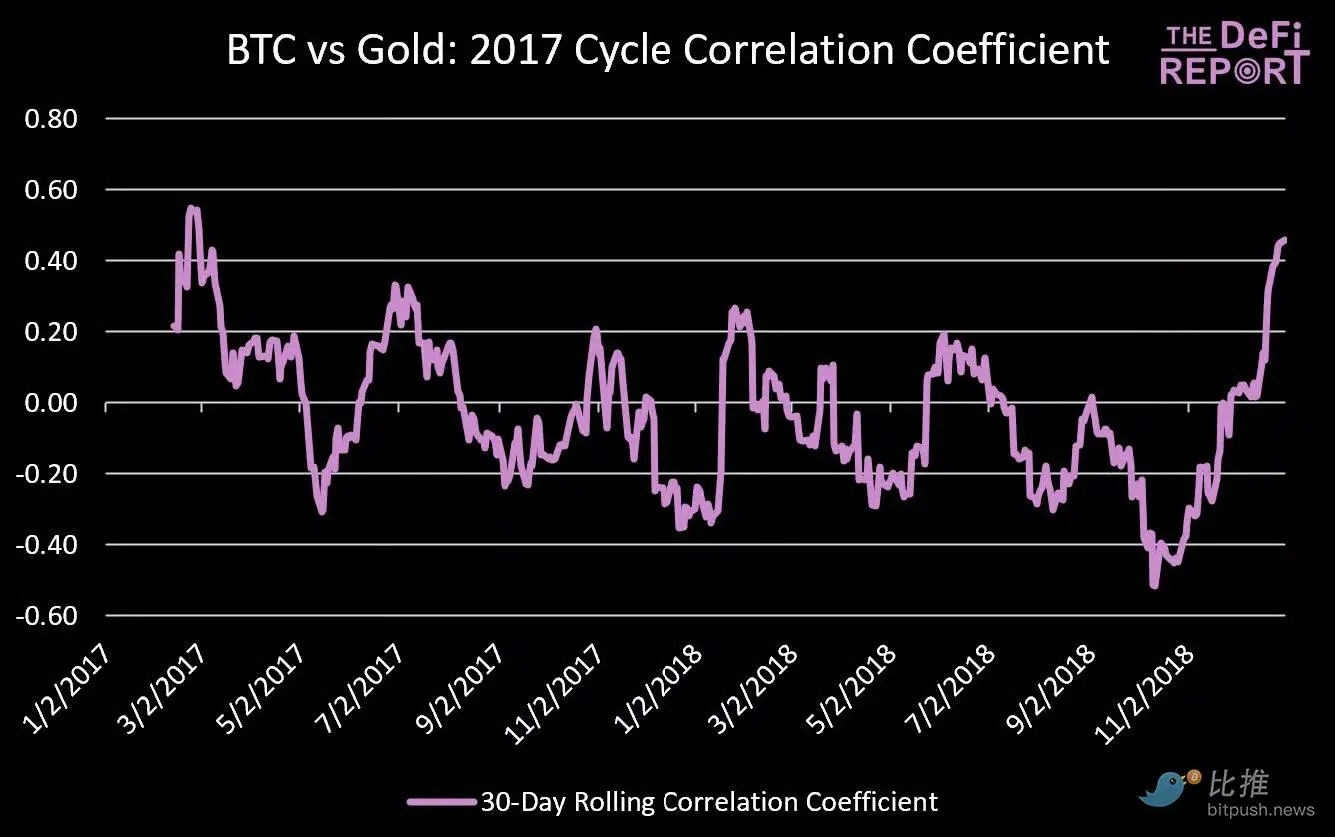
2017 cycle data source: The DeFi Report
During the 2017 bull cycle, Bitcoin showed a weak correlation with gold.
The R² for that period was just 0.033, meaning that from 2017 to 2018, gold could only explain about 3.3% of Bitcoin’s price movements.
2021 Cycle
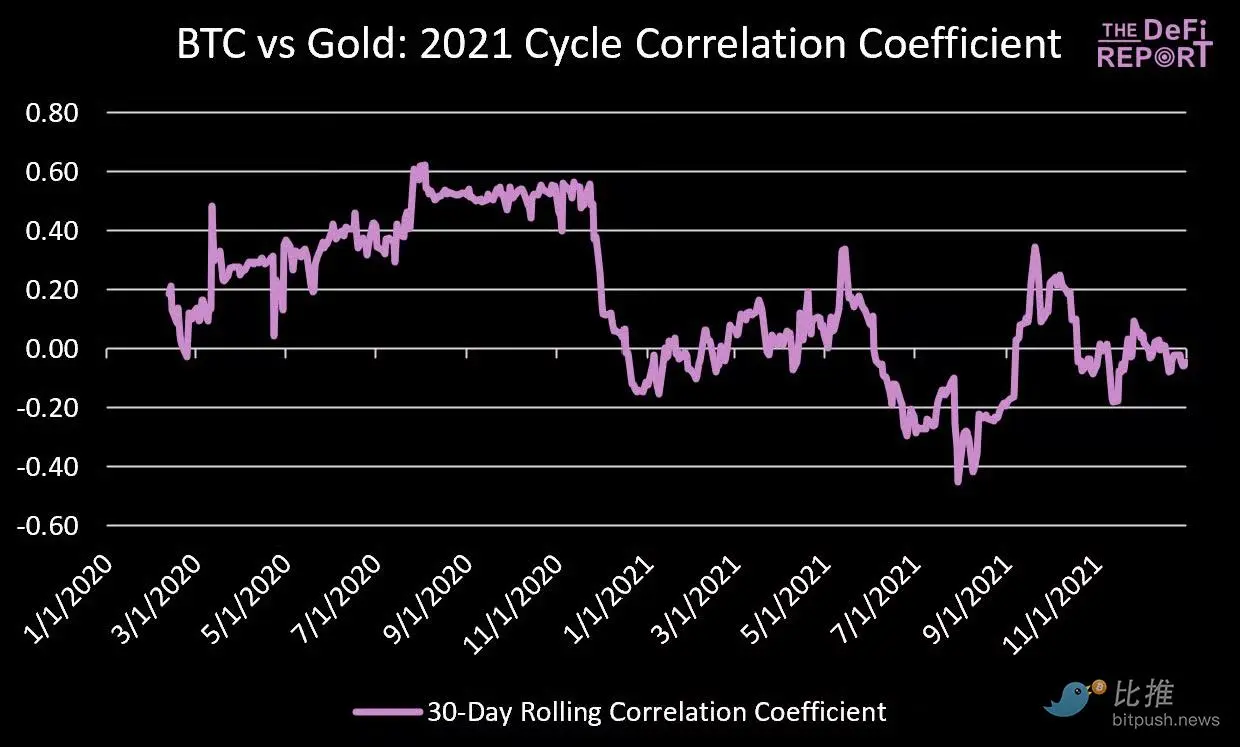
Data source: The DeFi Report
Based on a 30-day rolling correlation, Bitcoin has shown a slightly stronger relationship with gold, particularly in 2020 as the two assets rallied together.
2025 Cycle
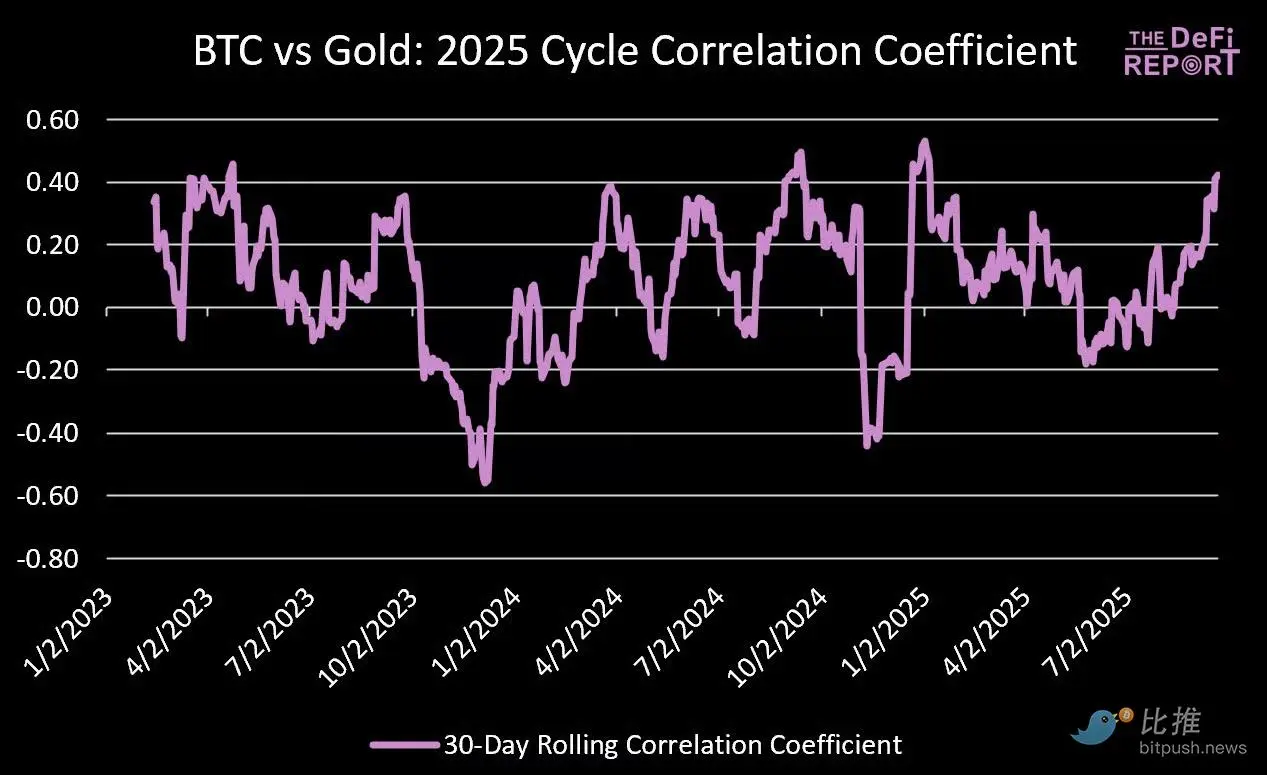
Data source: The DeFi Report
In this cycle, the correlation between the two has weakened.
The R² for this period was 0.015 – meaning that gold only explains 1.5% of Bitcoin’s price movements during this cycle.
Beta coefficient
Analysis As mentioned above, the correlation between Bitcoin and gold is very weak.
What about beta? Is Bitcoin like a “leveraged gold bet”?
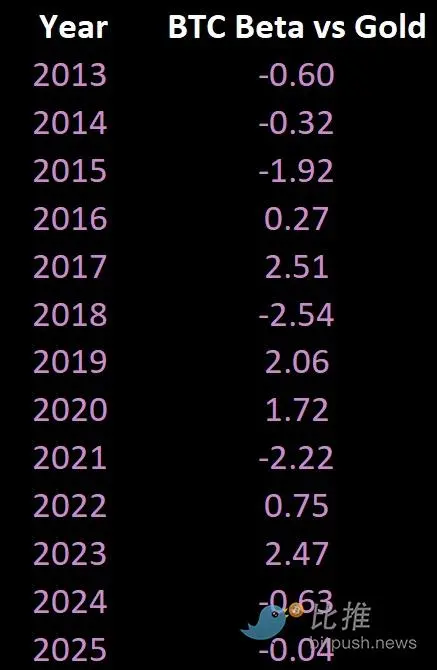
Data source: The DeFi Report (monthly)
The answer is complex. It did play that role in 2017, 2019, 2020, and 2023.
However, in 2015 (a year of Bitcoin decline), 2018 (another year of decline), and 2021 (a year of significant Bitcoin growth), Bitcoin's price movement was in the opposite direction of gold.
Bitcoin vs. Gold Returns
Gold enthusiasts are rejoicing as the asset has outperformed Bitcoin year-to-date (39% vs. 19%). Gold is up 102% since January 1, 2023, and the gold mining sector has performed even better (VanEck's Junior Gold Miner ETF, GDXJ, is up 122% year-to-date).
We’re even seeing some cryptocurrency investors start adding gold to their portfolios.
But if you own Bitcoin, do you really need gold in your portfolio?
This section of the report aims to answer this question.
Data source: The DeFi Report
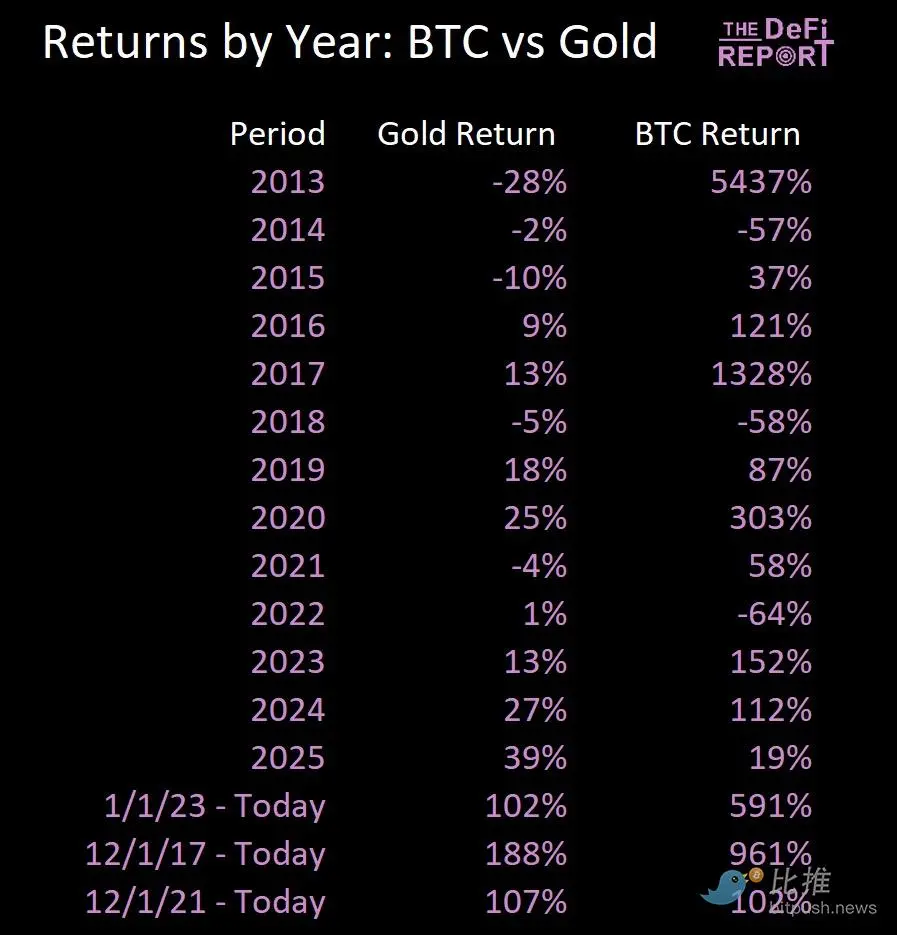
Data source: The DeFi Report
Bitcoin has historically had superior returns (and volatility) compared to gold.
But how does it compare to gold’s returns when we adjust for risk?
Risk-adjusted returns
- Sharpe Ratio: A measure of the return earned per unit of risk (measured by volatility, including both upside and downside).
- Sortino Ratio: Measures the return per unit of downside risk. Unlike the Sharpe Ratio, it only accounts for "bad" volatility (i.e., downside volatility).
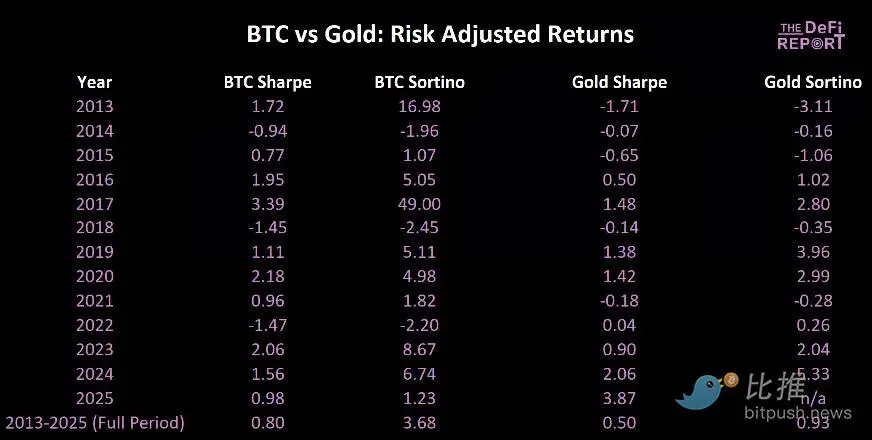
Data source: The DeFi Report
We can see that Bitcoin tends to generate excellent risk-adjusted returns in bull market years (2017, 2020, 2023). However, in bear market years (2014, 2018, 2022), its Sharpe ratio also falls into negative territory due to its high volatility.
That being said, the Sharpe ratio isn’t the best metric for Bitcoin because it penalizes all volatility (including upward volatility).
This is why we prefer to use the Sortino ratio for Bitcoin (which only penalizes downside volatility).
We can see that Bitcoin produces an excellent Sortino Ratio, which suggests that its volatility is a feature, not a bug.
For reference, a Sortino ratio over 2.0 is considered excellent.
Impact of 5% Configuration
Data source: The DeFi Report
Total returns since January 1, 2018 (5% allocation):
- 100% S&P 500: 149%
- 95% S&P 500 + 5% Gold: 152%
- 95% S&P 500 + 5% Bitcoin: 199%
If the allocation to Bitcoin and gold is 10%:
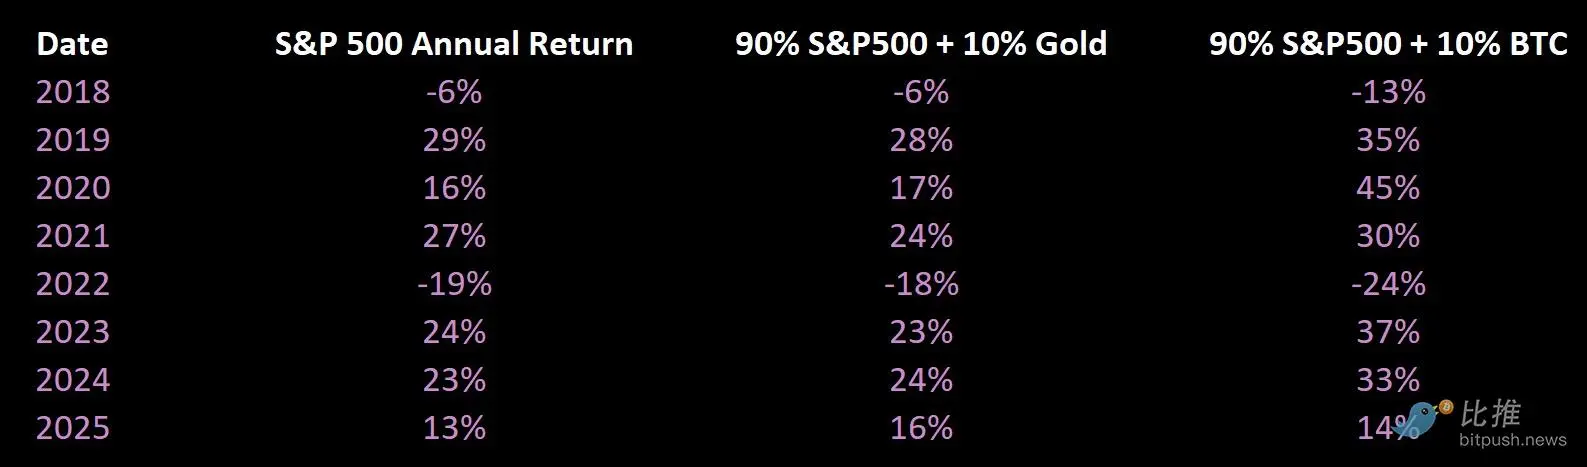
Total returns since January 1, 2018 (10% allocation):
- 100% S&P 500: 149%
- 90% S&P 500 + 10% Gold: 155%
- 90% S&P 500 + 10% Bitcoin: 253%
If you are primarily a cryptocurrency investor, should you own gold?
In our view, if you are seeking excess returns and can tolerate some volatility, Bitcoin is the superior asset. If your primary goal is to preserve value, then gold certainly has a place.
In many ways, we believe the merits of these two assets are generationally specific. Millennials and Gen Z favor Bitcoin due to its asymmetric upside potential. Baby boomers may prefer gold due to its inflation hedge (less upside potential, but a proven track record of preserving value).
We used to hold gold, but we moved 100% of our “hard currency” allocation to Bitcoin for the following reasons:
- Asymmetric Upside Potential: Bitcoin’s global penetration is very low compared to gold.
- Superior scarcity: With a hard cap of 21 million coins, supply is less elastic in its response to demand.
- Portability: Bitcoin is a hard currency asset that has global payment networks and accounting systems.
- Divisibility: Gold cannot be easily divided or fractionated.
- Transparency and Verifiability: The circulating supply of gold is unknown, and verifying its purity and ownership requires third-party trust.
- Liquidity and 24/7/365 market access.
- Demographics: Bitcoin is global and has stronger brand equity among younger generations.
- Financialization: Bitcoin is increasingly integrated into the global financial system.
Conclusion
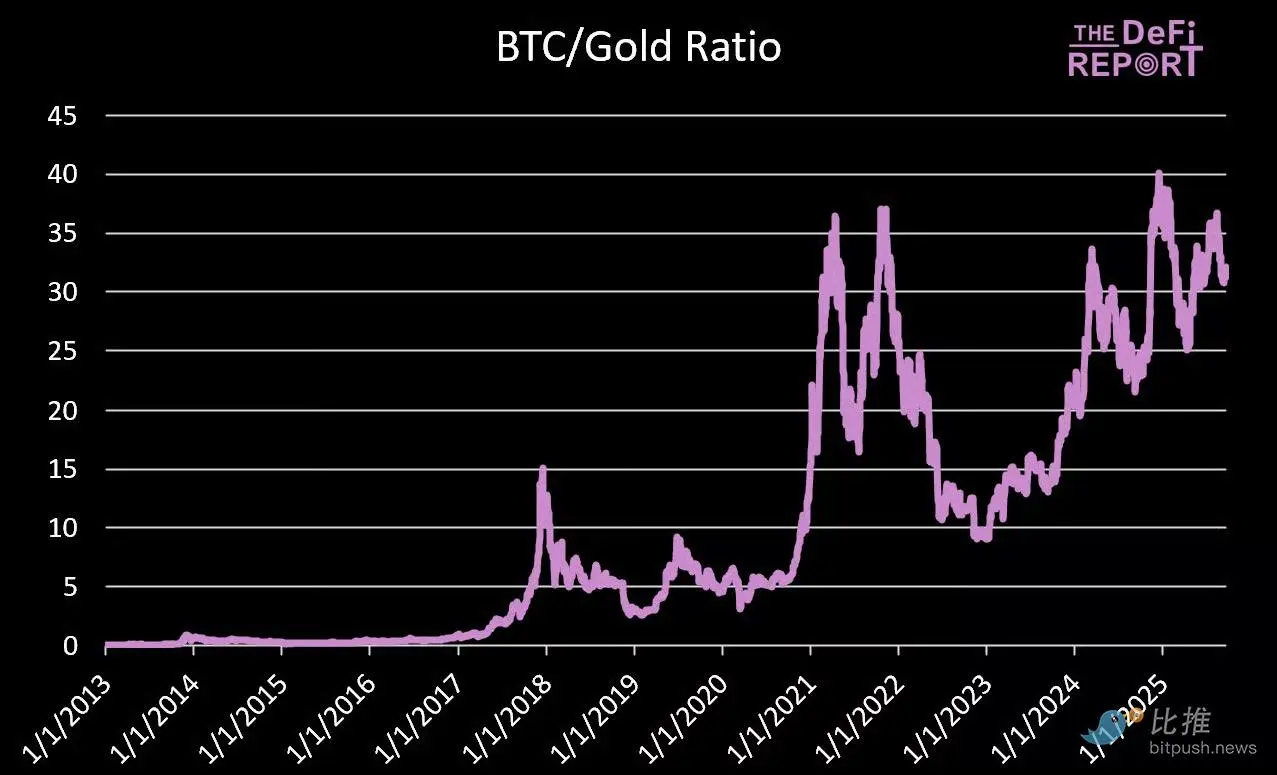
Over the 21-year cycle, it feels like “gold leads Bitcoin.” However, it’s difficult to find solid evidence of a lasting correlation between the two assets.
Bitcoin is often referred to as "digital gold" because of its "hard currency" characteristics.
But the way it trades bears little resemblance to gold – which acts as an inflation hedge due to its inverse correlation with the dollar and real interest rates.
Instead, Bitcoin is emerging as a standalone asset class – driven by technology adoption, financialization, global liquidity, reflexivity, and the adoption cycle.


You May Also Like

X Cashtags Add Real-Time Crypto Market Data

Iran Nuclear Deal Bitcoin: The 20-Year Offer


