

Dogecoin (DOGE) Price: Can Bulls Defend Key Trendline After 23% Drop
TLDR
- Dogecoin has declined below $0.250 and is currently consolidating near the $0.230 support level
- The coin is trading below key moving averages with bearish technical indicators showing downward momentum
- A descending trendline from late 2024 continues to act as resistance, limiting upward movement
- Critical support levels sit at $0.23-$0.24 range, with stronger backing near $0.20
- Bulls need to push above $0.28-$0.30 zone for any meaningful recovery to begin
Dogecoin has entered another period of weakness as the meme coin struggles to maintain key price levels. The digital asset recently dropped below the important $0.250 threshold and continues to face selling pressure.
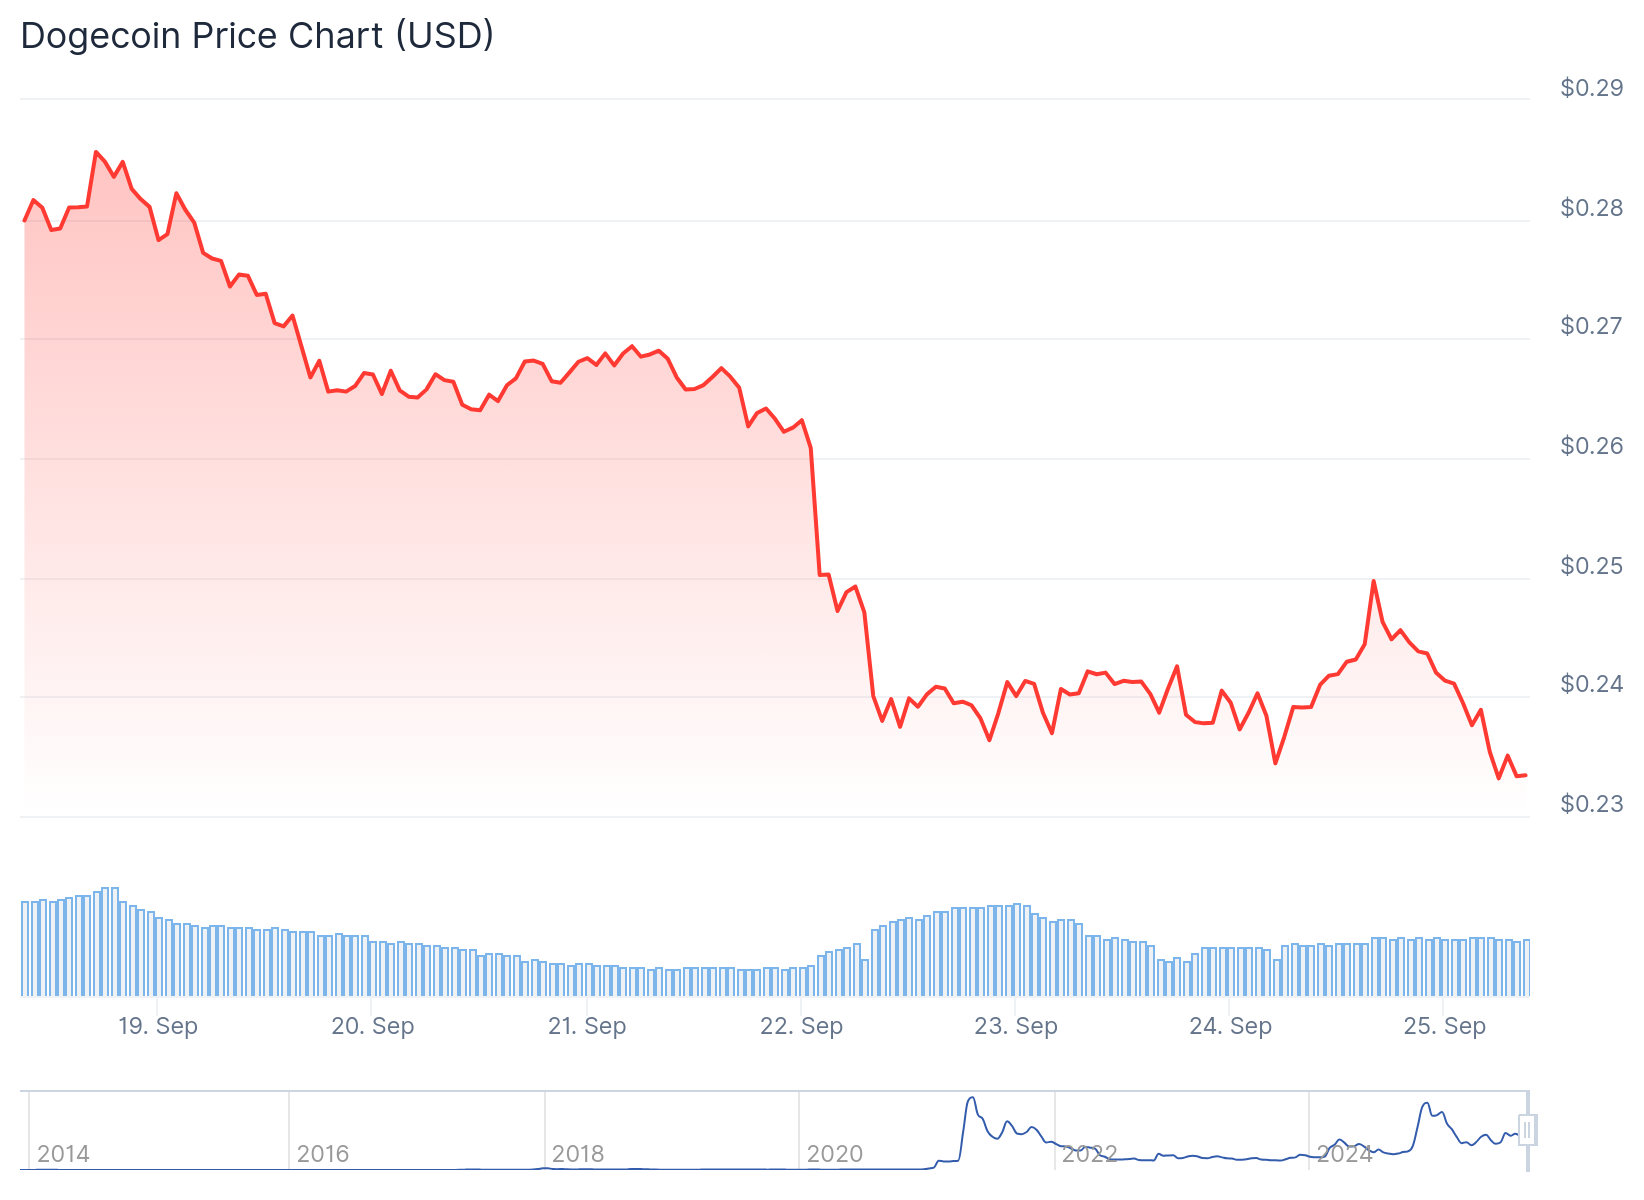 Dogecoin (DOGE) Price
The decline took DOGE below multiple support zones including $0.250 and $0.2450. Trading activity pushed the price as low as $0.230 before a modest recovery attempt began.
Despite the brief bounce, bears remain active near resistance levels. A bearish trendline has formed on the hourly charts with resistance positioned at $0.2450.
The current price action shows DOGE trading beneath both the $0.250 level and the 100-hourly simple moving average. This technical setup suggests continued weakness in the near term.
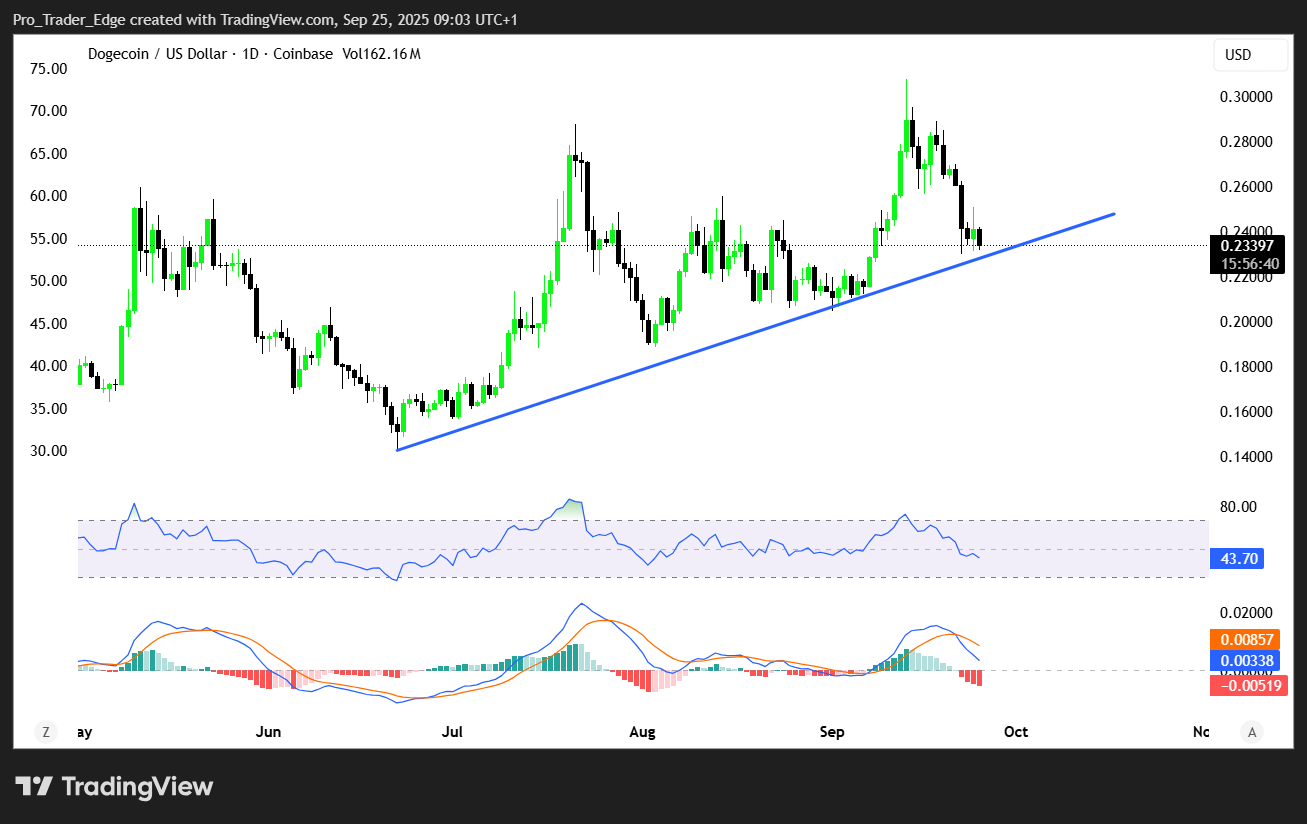 Source: TradingView
Technical Picture Remains Bearish
Recovery attempts have faced immediate resistance around $0.2450 where the descending trendline sits. The first major resistance level for any sustained bounce would be the $0.250 zone.
Higher resistance levels include $0.260, which aligns with the 50% Fibonacci retracement of the recent decline. A close above this level could target $0.2780 and potentially $0.2840.
The longer-term chart reveals DOGE testing a critical descending trendline that has capped rallies since late 2024. This line now acts as both resistance and a key technical level to monitor.
Current support levels are positioned around $0.23-$0.24, with more substantial backing near $0.20. These zones represent crucial areas that bulls must defend.
Key Levels to Watch
If the current support at $0.2320 fails to hold, the next major support sits at $0.230. Below that level, the main support zone is located at $0.2250.
A breakdown below $0.2250 could accelerate selling toward $0.2120 or even $0.2050. Such a move would represent a deeper correction for the meme coin.
For bulls to regain control, DOGE needs to push above the $0.28-$0.30 resistance zone. This area has consistently rejected price advances and represents a critical hurdle.
A decisive break above $0.30 could trigger momentum toward $0.35-$0.37, providing the catalyst bulls need for a sustained rally.
The hourly MACD indicator shows increasing bearish momentum, while the RSI has dropped below the neutral 50 level. Both technical indicators support the current downward bias.
Market sentiment remains cautious as Bitcoin and broader cryptocurrency markets continue range-bound trading. This environment limits speculative capital flowing into alternative coins like DOGE.
Low trading volume compounds the challenge, as insufficient demand prevents meaningful price advances. Repeated rejections near key resistance levels have made traders more hesitant.
The pattern suggests continued consolidation without a clear directional breakout in the immediate term. Price action remains confined within established support and resistance boundaries.
Trading activity shows DOGE attempting to retest the descending resistance line that has defined its recent price action. Whether this level holds as support or breaks lower will determine the next phase.
DOGE currently trades near $0.230 with immediate resistance at $0.2450 and support at $0.2320.
The post Dogecoin (DOGE) Price: Can Bulls Defend Key Trendline After 23% Drop appeared first on CoinCentral.
You May Also Like

CEO Sandeep Nailwal Shared Highlights About RWA on Polygon

BlackRock Increases U.S. Stock Exposure Amid AI Surge
