

Ethereum Price Targets $5000 as Market Sentiment Turns Bullish

Highlights:
- Ethereum price is showing strength, as it has surged 2% to $4534.
- CryptoQuant data suggests intense demand and staking in the ETH market.
- Ali Martinez foresees a rally to $5000 in the Ethereum price soon.
The bullish trend for Ethereum price is still active, as it has risen 2% to $4534. However, its daily trading volume has slipped 14% to $34.71 billion. Meanwhile, Ethereum (ETH) is in one of the strongest cycles in its existence, with many signals suggesting a rise to dominance in the cryptocurrency space. Institutional demand, staking, and activity on-chain are all near record highs.
According to CryptoQuant data, a significant portion of fund holdings is in the form of ETH, with a collective of over 6.7 million ETH. This might be a clear sign of interest from institutions. This time surge indicates that large-scale investors are taking a chance on the future of Ethereum as more capital investments are poured into the network.
Additionally, Ethereum’s role in decentralised finance (DeFi) and smart contracts continues to grow, making it a go-to asset for institutions and retail investors alike. As on-chain metrics like active addresses and transaction volume continue to climb, it becomes increasingly obvious that ETH is a strong long-term investment. These signs show it’s not only recovering, but Ethereum is setting the stage for new all-time highs.
ETH Market Sentiment Turns Bullish
Moreover, ETH’s price trends have become more closely correlated with the increase in open interest in the futures market. The open interest in Ethereum futures has grown tremendously, reaching $60 billion, which signals an influx of capital from futures traders. The higher open interest usually indicates that investors are making larger bets on where the Ethereum price will go in the future and pushing demand higher.
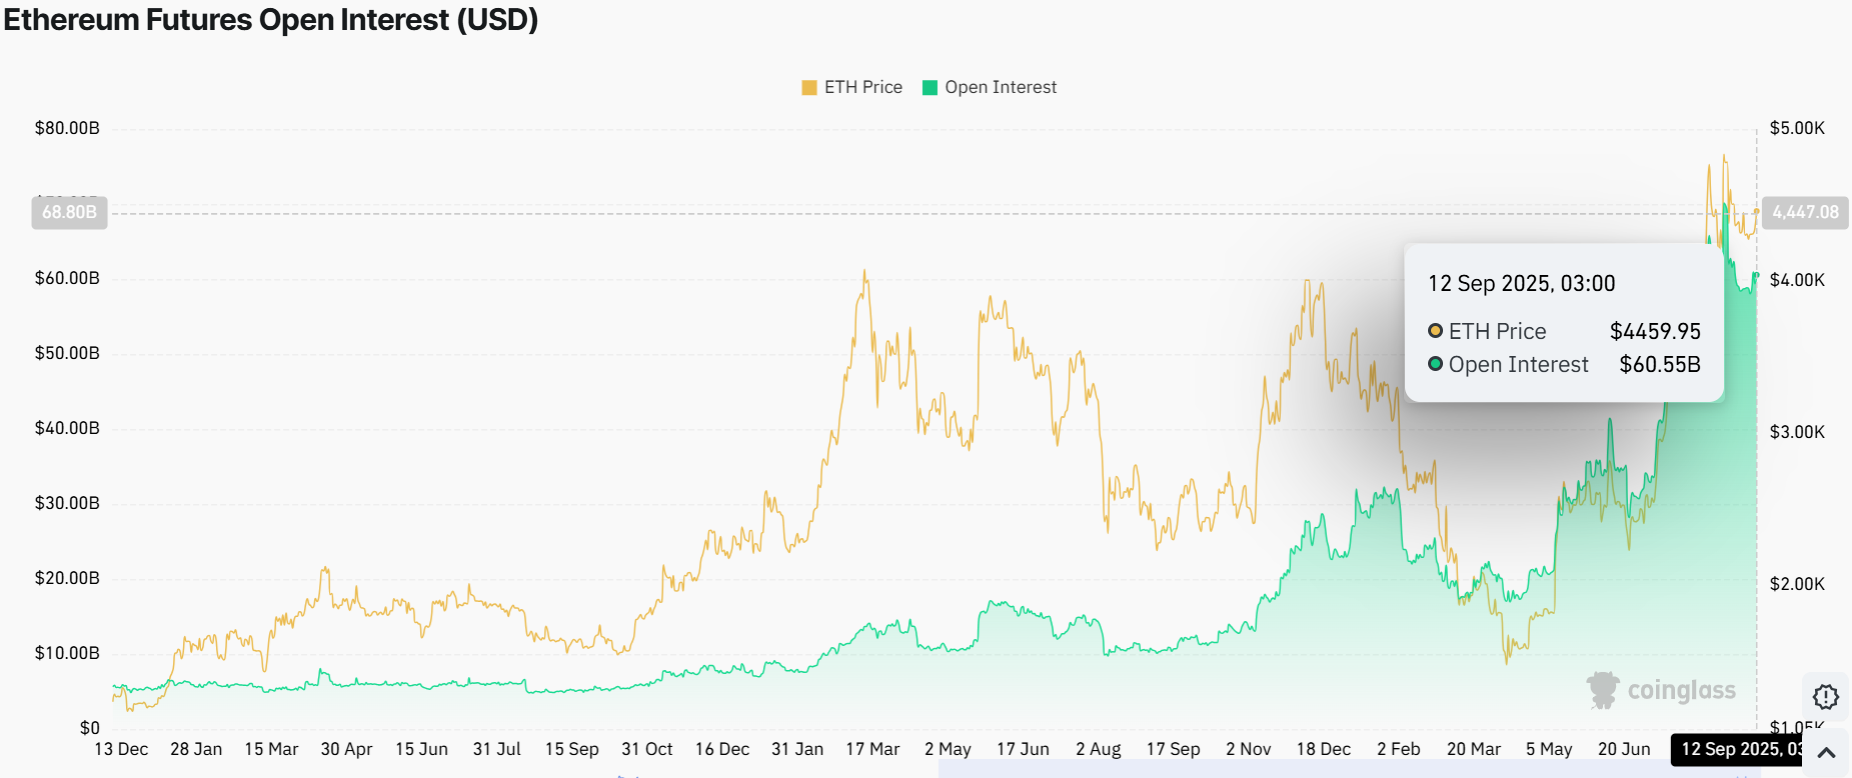 Ethereum Futures Open Interest: Coinglass
We can see that there has been a correlation between price movements and open interest. As the Ethereum price rises, there is usually a follow-up of an increase in open interest, which is an indication that the market is in an accumulation phase. This may also signal that traders are looking forward to ETH breaking through the $5000 barrier in the near future.
Another interesting trend in Ethereum’s price movement is the long/short ratio trades, which is an indicator of market sentiment. The long-to-short ratio is a healthy 50.33% long positions to 49.67% short positions. This is a balanced sentiment, indicating that although traders are bullish, they’re cautious too.
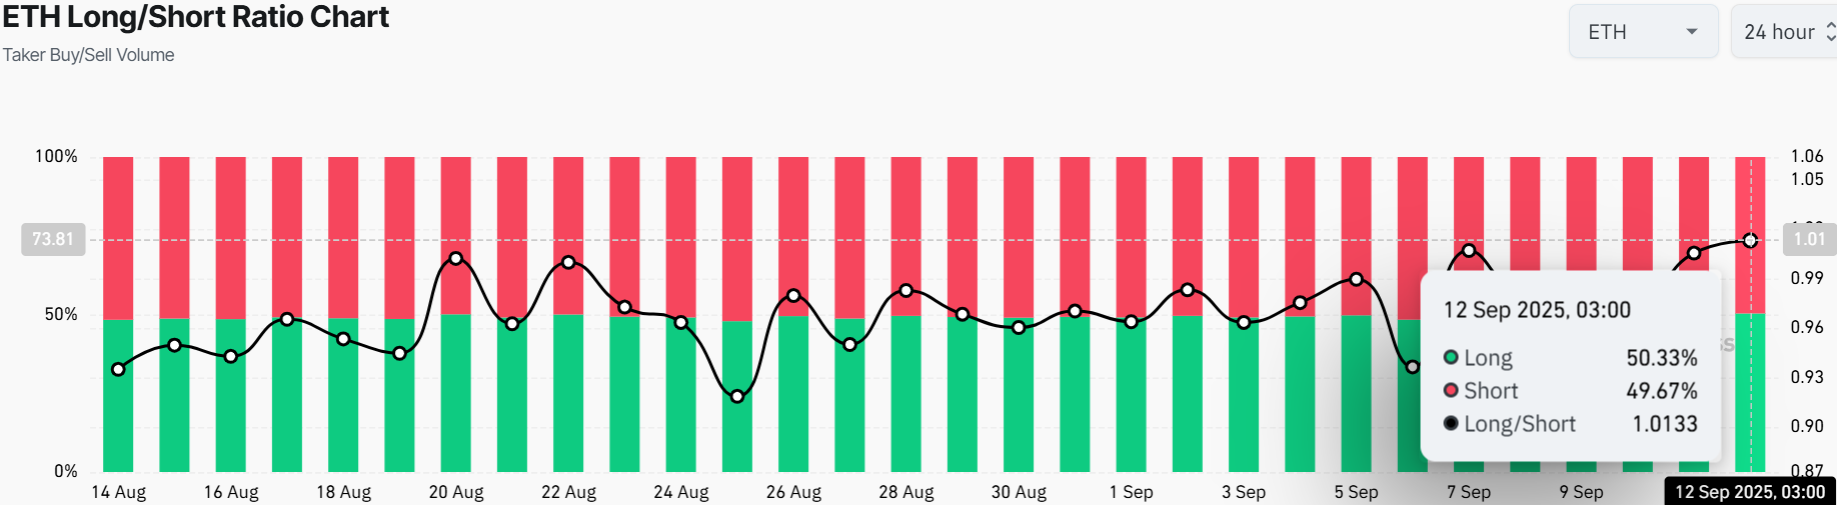 ETH Long/Short Ratio Chart: Coinglass
This ratio suggests a market that acknowledges Ethereum’s potential. The volatility in the price of Ethereum is likely to continue, but the current structure of the market indicates that traders are less willing to maintain their short-term positions. This is because Ethereum continues to show strength in its price movements. A quick look at the ETH/USD 1-day chart reveals that the bulls have built strength within the rising channel. Moreover, with the support zones at $4207 and $2778, the buyers are having the upper hand.
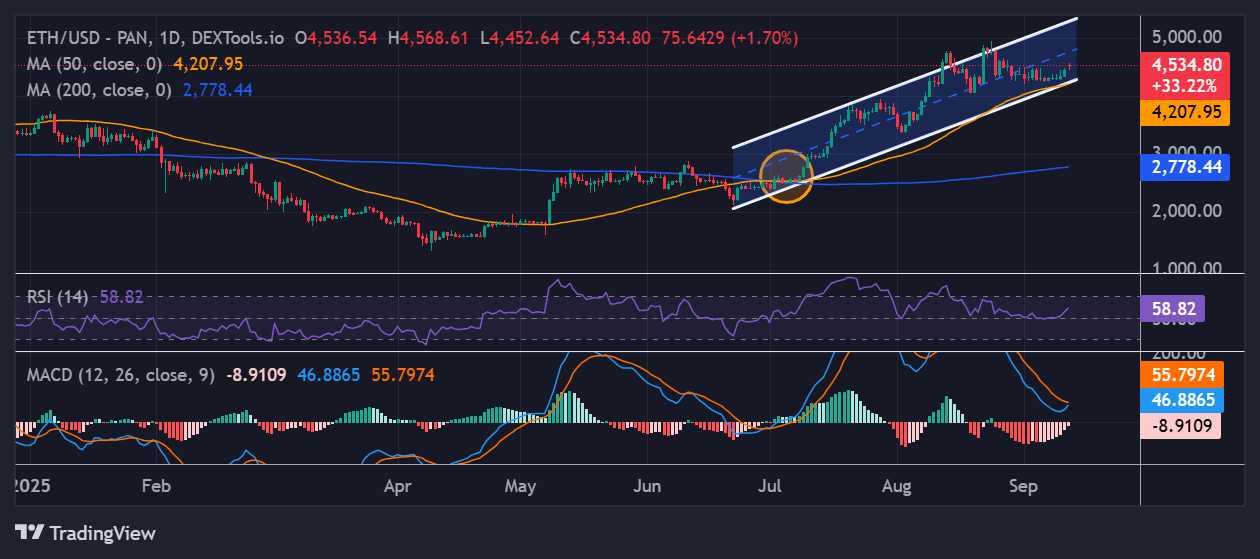 ETH/USD 1-day chart: TradingView
The technical indicators, including the RSI, suggest that there is still room for more upside as it sits at 58.82. However, the Moving Average Convergence Divergence shows a looming buy signal. This will only be manifested if the blue MACD flips above the orange signal line.
Analyst Forecasts a Rally to $5000 in Ethereum Price
The 2% pump indicates that the Ethereum price is gaining momentum and potential, but traders should tread carefully. Moreover, Ali Martinez has predicted a potential rally to $5000 in ETH as it is breaking out.
In the short term, the ETH price could push to $4700 within the next few days, with a stretch goal of $5000 if volume spikes. Conversely, if the bears step in, ETH may drop towards $4200.
eToro Platform
Best Crypto Exchange
- Over 90 top cryptos to trade
- Regulated by top-tier entities
- User-friendly trading app
- 30+ million users
eToro is a multi-asset investment platform. The value of your investments may go up or down. Your capital is at risk. Don’t invest unless you’re prepared to lose all the money you invest. This is a high-risk investment, and you should not expect to be protected if something goes wrong.


You May Also Like

Analysts Model 8x Potential for This Cheap Crypto Under $1, Here’s Why
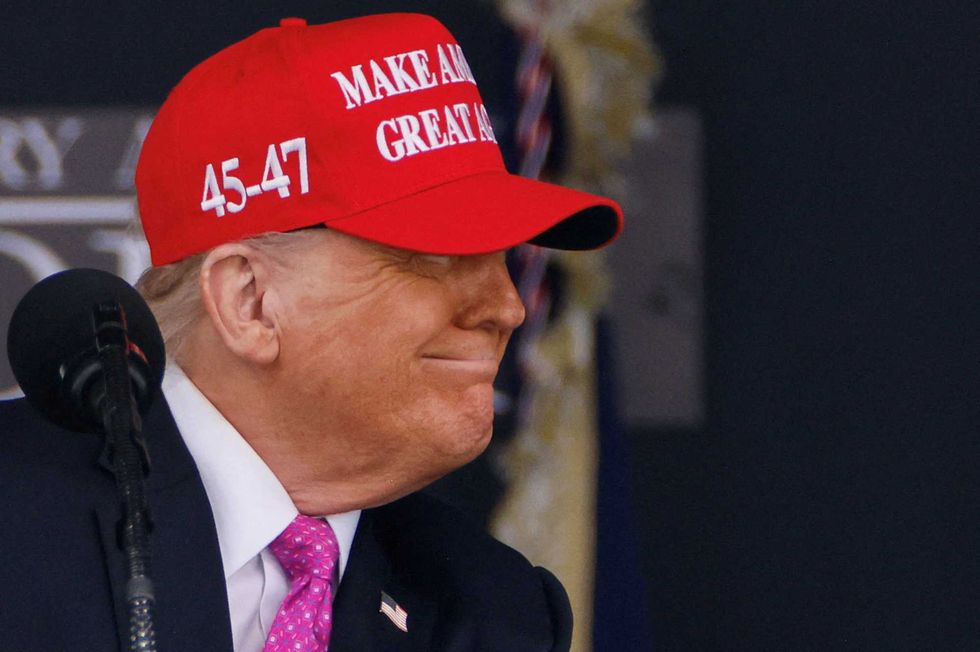
Trump-voting C-SPAN caller throws away MAGA hat: 'I apologize to all of America'


