Ethereum Price Warning: Rare Weekly Sell Signal Flashes, 63% Correction Possible
Ethereum price has stayed under pressure since mid-April, and the latest weekly signal now gives bulls another reason to stay cautious. ETH price has moved inside a broad range for months, but the failure to break clearly above $2,400 has kept the market exposed to another pullback.
Ali Charts believes that risk is now increasing because the TD Sequential indicator has flashed a fresh weekly sell signal for Ethereum. His point is simple. This same indicator has tracked ETH price movements with strong accuracy over the past year, and every major signal on the weekly timeframe has led to a notable move.
Ali Charts Says Ethereum Has Printed A New Weekly Sell Signal
Ali Charts pointed to 3 major examples from the past year. The first came on April 14, 2025, when the TD Sequential gave a buy signal before Ethereum rallied 87%. Another buy signal appeared on June 16, 2025, and ETH later climbed 134%.
The warning came from the sell signal on August 25, 2025. That signal arrived before Ethereum price entered a sharp corrective phase that eventually erased 63% from its value.
Ali Charts now says another weekly sell signal has just closed. That makes the current setup important because the same pattern has already worked several times before. The signal does not guarantee a crash, but it does show that Ethereum may be entering a weaker phase if selling pressure increases.
Ali Charts identified 3 possible downside levels if Ethereum price starts to lose support. The short term target is $1,900. That level would mark the first major test if ETH begins falling from its current region near $2,250.
The mid-term target sits at $1,565. That area becomes more important if the $1,800 support fails and sellers gain stronger control.
The deeper target is $1,090. Such a move would need a much harsher market breakdown, but Ali Charts included it as a longer range risk if the correction grows wider.
This outlook does not mean Ethereum must repeat the previous 63% correction. It means the current sell signal deserves attention because the same weekly indicator has already matched several major ETH price turns.
Ethereum Price Analysis Shows Bulls Still Need To Break $2,400
A separate look at the Ethereum price chart supports part of Ali’s warning. ETH has traded between $1,800 and $2,400 since February, and that range has now become the main battleground.
The $2,400 zone remains the resistance to beat. Ethereum price has failed to break above that area with strength, which keeps buyers on the defensive.
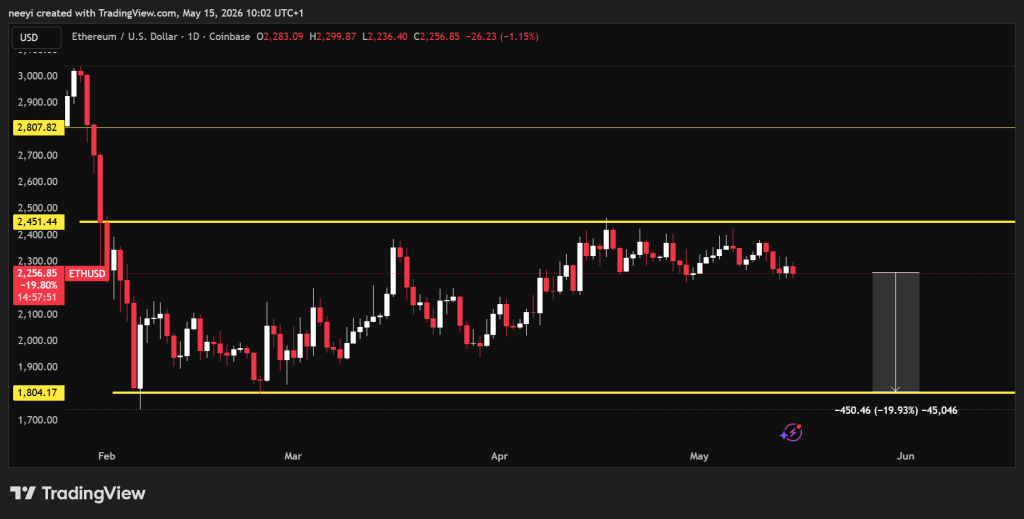 Ethereum Price Chart Showing Recent Trading Range / Source: TradingView.com
The $1,800 region remains the most important support. Bears still need to break that level before the path toward deeper targets becomes clearer.
A drop from around $2,250 to $1,800 would represent about 20% downside. That move alone would not confirm the full bearish case, but it would place ETH price in a much weaker position.
Related Article: $5,000 in Ethereum (ETH) Today – Here’s Your Portfolio Value by 2027
Ethereum RSI And MACD Readings Support The Pullback Risk
The RSI reading near 45 also leans bearish. Readings below 50 usually show that sellers have stronger control than buyers. Ethereum still has room to fall before it becomes deeply oversold, which means the market may not have reached exhaustion yet.
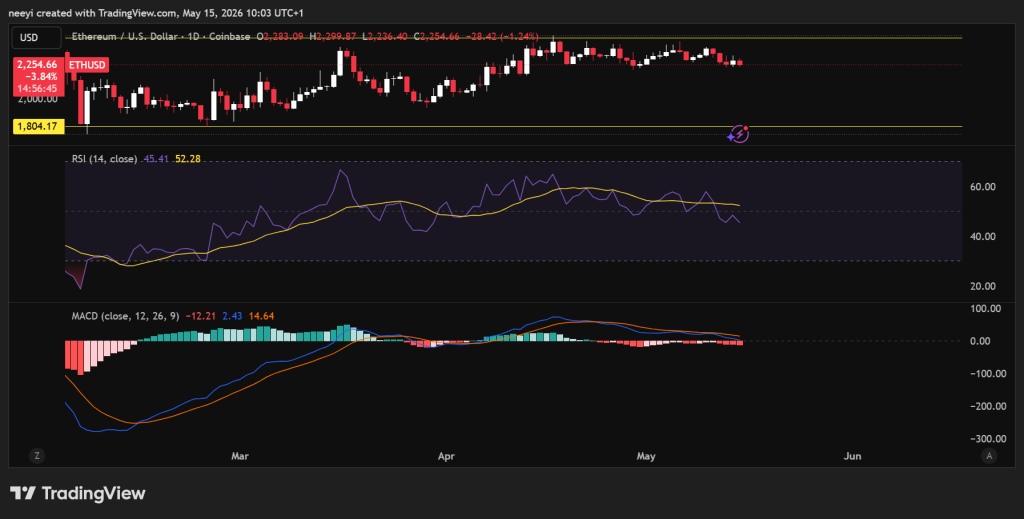 Ethereum Price Chart Showing RSI and MACD Readings / Source: TradingView.com
MACD also supports a cautious view. The indicator shows weakening upside pressure, and the lines appear close to a bearish crossover. That setup often appears when a market is losing strength after a failed recovery.
Ethereum price now faces a clear test. Bulls need to reclaim $2,400 to weaken Ali Charts’ bearish warning. Failure to defend $1,800 would make the lower ETH price targets far more relevant.
FAQs
Subscribe to our YouTube channel for daily crypto updates, market insights, and expert analysis.
The post Ethereum Price Warning: Rare Weekly Sell Signal Flashes, 63% Correction Possible appeared first on CaptainAltcoin.


You May Also Like

Pricing and delivery capacity limits Starlink’s dominance in Nigeria’s internet market

Bybit Rides BILL Trading Momentum with 77% CEX Market Share