Stellantis Stock steadies at $7.84 as BofA cuts it to Underperform

Stellantis Stock stabilizes near its daily pivot as short-term momentum firms, yet the broader trend remains capped below the 200-day baseline. The setup is neutral with a slight upward tilt, while a recent downgrade and Chinese EV pressure keep rallies in STLA constrained.
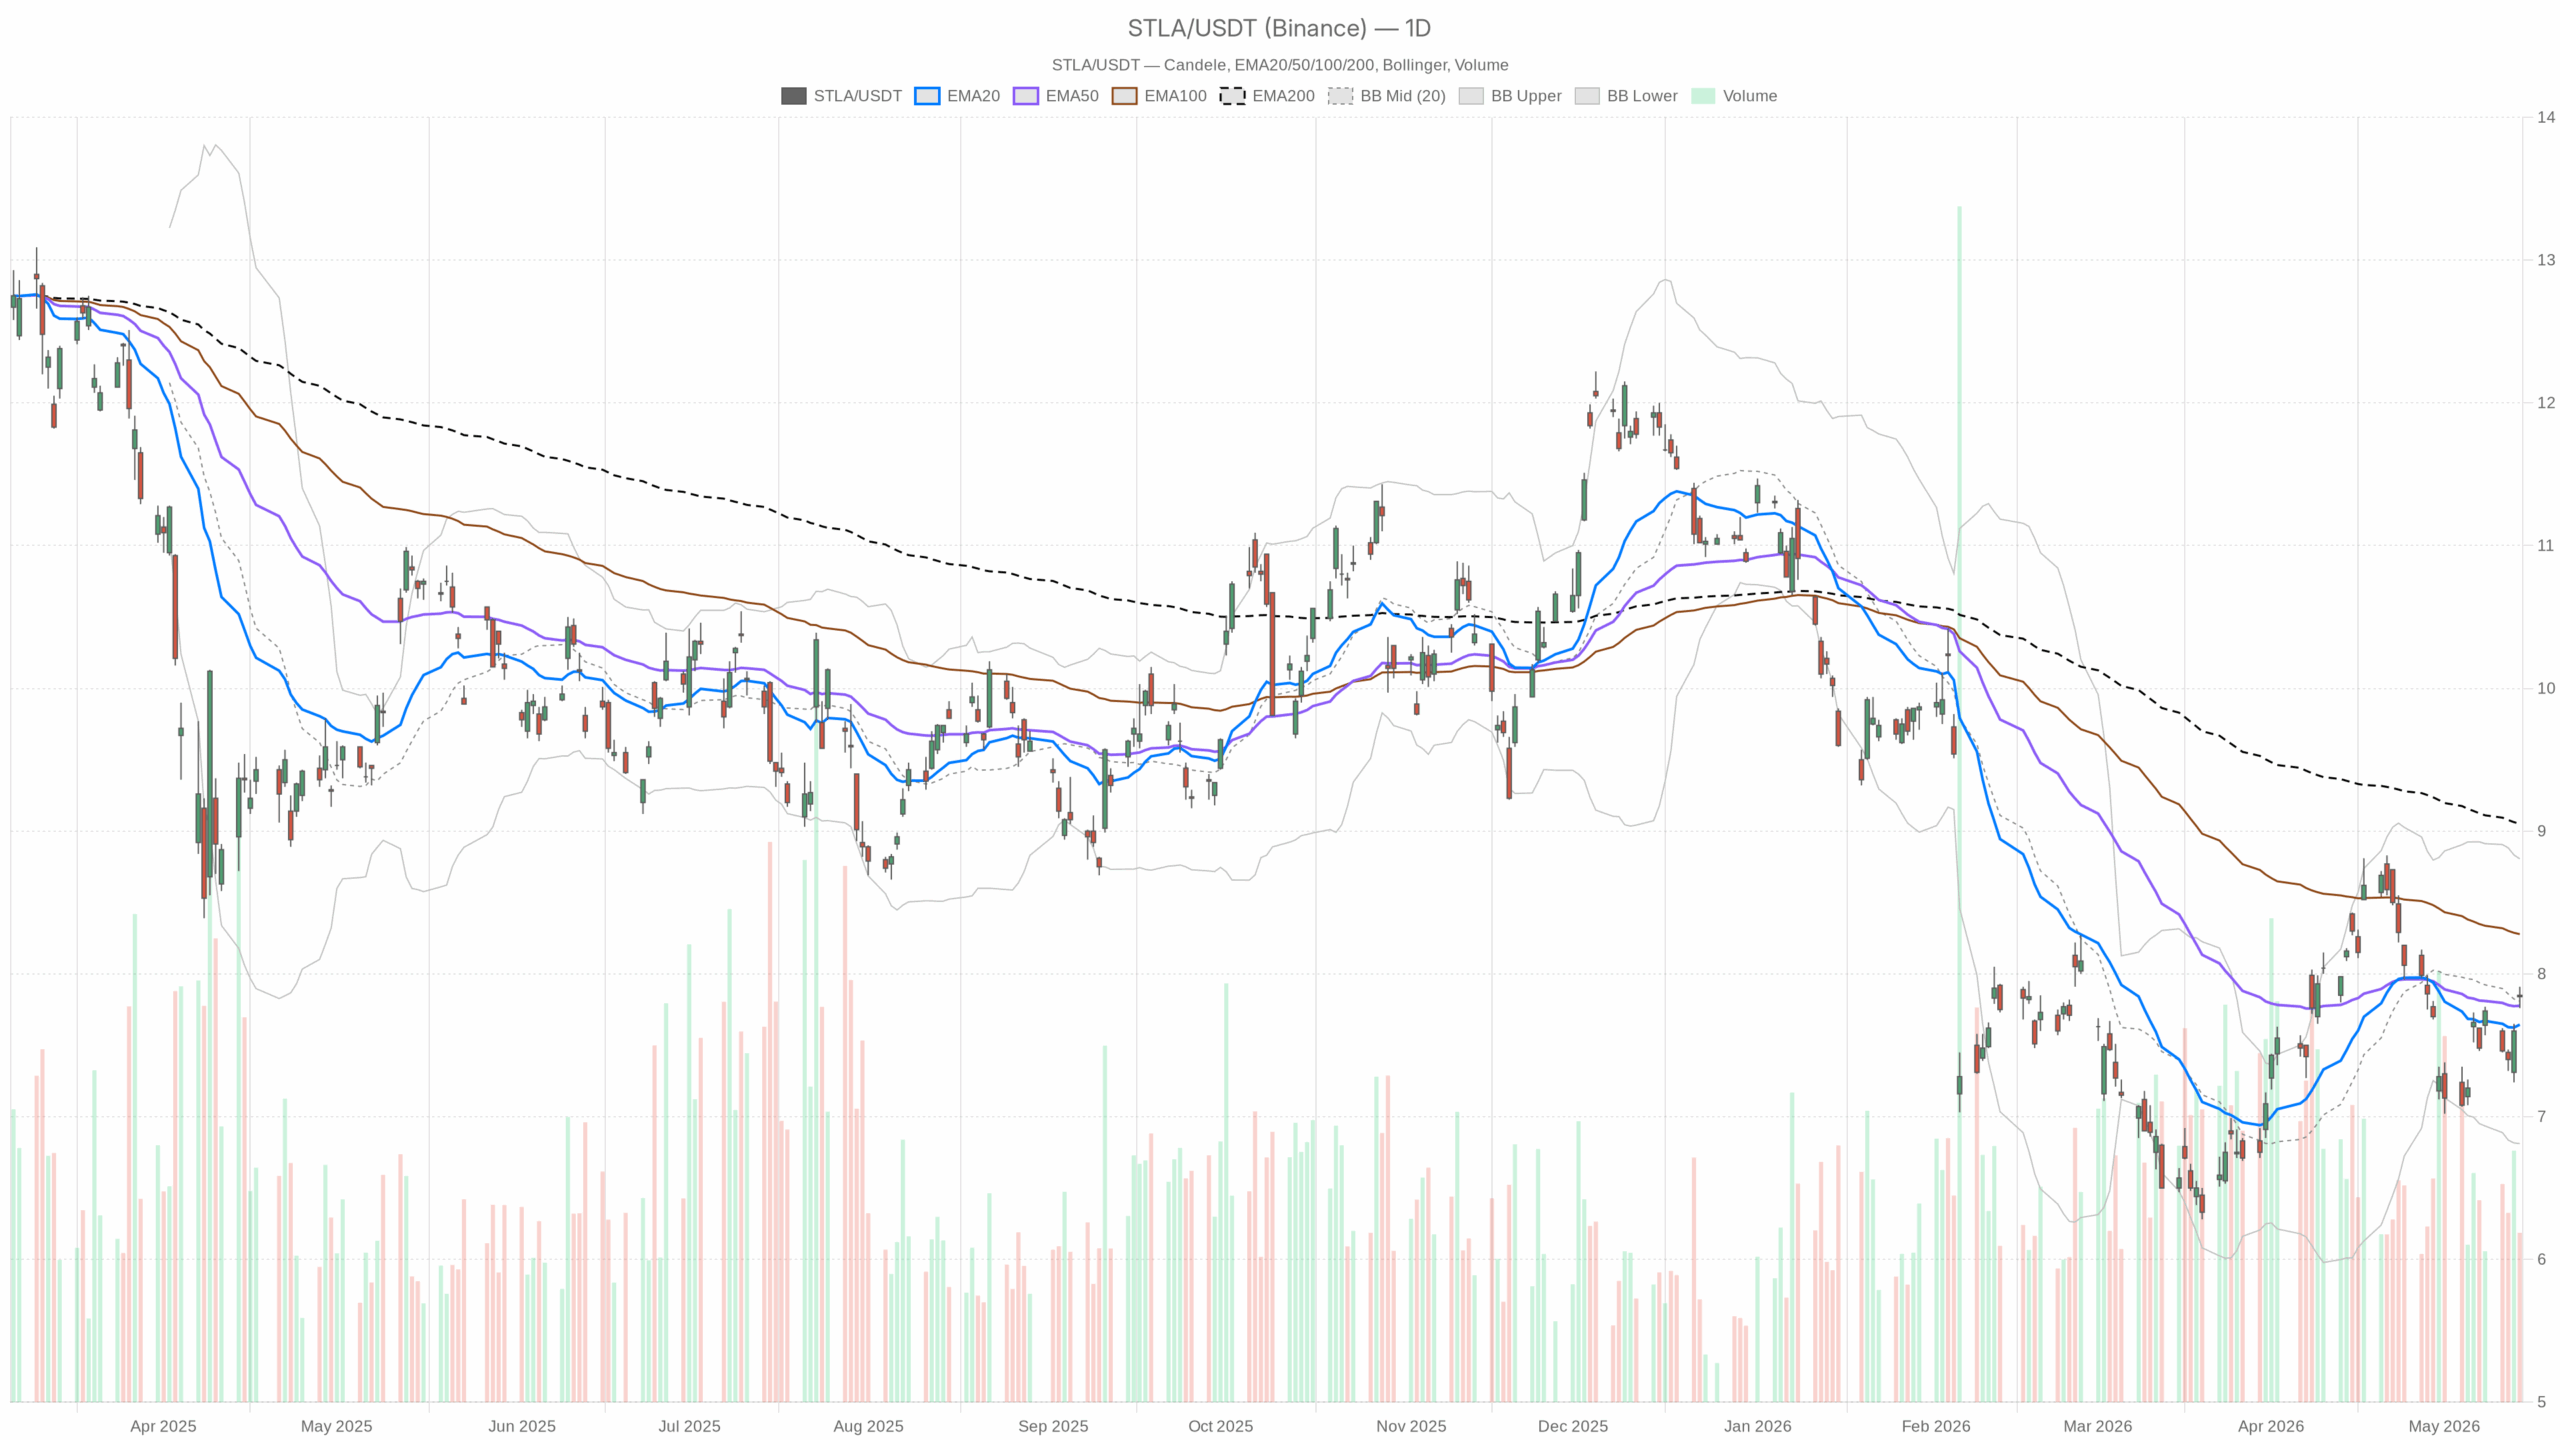 STLA — daily chart with candlesticks, EMA20/EMA50 and volume.
Stellantis Stock Daily Chart: Neutral Bias Above EMAs, Below 200-Day
Price and Moving Averages
On the daily chart, STLA closed at 7.84, almost exactly on the daily pivot at 7.84. That signals price equilibrium and indecision at a key reference. The range was 7.76–7.91, testing S1 and R1 without follow-through. The 20-day EMA sits at 7.64 and the 50-day EMA at 7.78, with price above both. However, the 200-day EMA is higher at 9.05, indicating a short-term recovery inside a still-broken longer trend.
RSI(14) printed 53.71, showing momentum is mildly positive and not stretched. Meanwhile, MACD is near flat with the line at -0.04 versus a -0.03 signal and a -0.01 histogram, so improvement has stalled and a turn positive is not yet confirmed. Bollinger Bands center on 7.81 with a 6.81–8.81 envelope, placing price near the mid-band with room both ways inside a wide volatility channel. ATR(14) is 0.30, keeping daily volatility moderate and contained. Notably, pivot levels frame the day with R1 at 7.91 and S1 at 7.76 as immediate breakout and breakdown pivots for directional confirmation.
News and Sentiment Headwinds for Stellantis Stock
News flow complicates the picture. Bank of America cut STLA to Underperform and reduced its target to €5.50, citing intensifying competition from Chinese EV makers. This is a sentiment headwind that can cap rallies at resistance. Additionally, a valuation take highlights recent share weakness over the past month and quarter. Therefore, fundamental buyers may probe dips, but confidence still requires technical validation.
1-Hour Timeframe: Near-Term Bid Supports Upside
On the 1-hour chart, the tone is firmer and supports the near-term bid. Price last traded at 7.83, above the 20-hour EMA at 7.67, the 50-hour at 7.59, and the 200-hour at 7.60. This keeps the intraday uptrend intact, with buyers in control above the moving average stack.
RSI(14) is 66.29, strong but not overbought. MACD is positive with a 0.09 line over a 0.06 signal and a 0.02 histogram, so momentum is building on the margin. The Bollinger mid-band is 7.61 with an upper band near 7.97, leaving space to test the upper band if buyers sustain pressure. ATR(14) is 0.10, keeping intraday ranges orderly. Notably, the 1-hour pivot is 7.83 with R1 at 7.85 and S1 at 7.81, and a push through 7.85 would be the next intraday tell.
15-Minute Execution Context: Bullish But Slowing
On the 15-minute chart, execution context leans bullish but is slowing. Price closed 7.83, above the EMA20 at 7.79, the EMA50 at 7.71, and the EMA200 at 7.57, keeping the micro-trend up. RSI(14) sits at 63.79, so buyers hold the initiative without extreme readings.
MACD shows the line at 0.03 versus a 0.04 signal with a -0.01 histogram, implying short-term momentum is easing. Therefore, a pause or small pullback is possible. Bollinger Bands center at 7.81 with a tight 7.78–7.85 envelope. Such compression often precedes a directional pop. ATR(14) is 0.03, signaling very low immediate volatility and favoring range trading until a catalyst.
Scenarios for STLA
Bullish Scenario
A firm hold above daily S1 at 7.76, followed by a sustained push through daily R1 at 7.91, would keep the short-term advance intact. Clearing 7.91 would validate the intraday trend against a neutral daily backdrop. On the 1-hour chart, maintaining the EMA20 at 7.67 as rising dynamic support and keeping RSI in the mid-60s would back a run toward the hourly upper band near 7.97 and the 8.00 handle. Moreover, a daily MACD flip to positive would strengthen the case for extending toward the upper half of the daily Bollinger channel over time.
Bearish Scenario
Failure at 7.85–7.91, followed by a break below 7.76, would weaken the short-term structure. A loss of S1 would hand the tape back to sellers. A daily close below the 50-day EMA at 7.78 and then the 20-day EMA at 7.64 would further invalidate the bullish tilt, as the rebound would give way to the prevailing longer-term weakness. Additionally, if 1-hour momentum rolls over with MACD crossing down and RSI slipping back toward neutral, risk would reopen toward the daily mid-band at 7.81 and, in a wider move, toward the lower band at 6.81. That would mark volatility expansion to the downside.
Overall Positioning and Key Levels
Overall, positioning argues for respect of levels rather than conviction calls. ATR(14) 0.30 and tight 15-minute ranges point to controlled volatility until a break of 7.76 or 7.91 provides direction. Meanwhile, external headwinds from the downgrade and EV competition keep uncertainty elevated, even as short-term buyers probe higher prints on Stellantis Stock.


You May Also Like

Crypto Market Sees $114 Million in Futures Liquidated in One Hour as Leverage Unwinds

$280M drained via social engineering