

Ethereum price risks drop to $1,800 as ascending channel breaks
Ethereum price remained under pressure on Wednesday as weakening technical indicators, rising Treasury yields, and continued ETF outflows pushed traders to closely monitor whether the second-largest cryptocurrency can defend the key $2,000 psychological support zone.
- Ethereum price fell below its ascending channel support as rising Treasury yields and persistent ETF outflows weakened market sentiment.
- MACD indicators turned bearish while ETH traded below its 20-day EMA, increasing the risk of a move toward the $1,800 support zone.
- CoinGlass data showed over $1.7 billion in leveraged long positions could face liquidation if Ethereum drops below the $2,040 level.
Ethereum (ETH) traded near $2,129 at press time, down roughly 12% from its recent local high near $2,420. The latest decline came as risk appetite across crypto markets deteriorated following another jump in U.S. bond yields and renewed concerns over slowing global growth. Bitcoin also slipped below short-term support levels, dragging most large-cap altcoins lower.
The selloff accelerated after U.S. 10-year Treasury yields climbed to 4.58%, their highest level in months, following hotter-than-expected inflation data. Elevated yields tend to reduce demand for speculative assets such as cryptocurrencies because investors can earn higher returns from lower-risk government bonds.
Market sentiment has also been weighed down by renewed global tariff tensions after the U.S. imposed a 15% global tariff package earlier this quarter. Investors have increasingly shifted toward defensive positioning amid fears that higher trade barriers could weaken economic activity and pressure technology and crypto valuations.
Ethereum has remained particularly vulnerable because of its strong historical correlation with the Nasdaq and other growth-sensitive technology assets. The recent pullback in AI and semiconductor stocks has coincided with softer performance across major altcoins as traders continue reducing exposure to higher-beta assets.
Institutional demand has also weakened. Spot Ethereum ETFs listed in the United States have continued recording persistent net outflows over recent weeks, removing an important source of buy-side liquidity from the market. Several funds have posted consecutive days of redemptions as investors rotate toward Bitcoin ETFs and fixed-income products.
Analysts have increasingly linked Ethereum’s weaker ETF demand to the absence of native staking rewards within approved U.S. spot products. Without yield generation, many institutions continue to favor Bitcoin exposure over Ethereum despite ETH’s larger upside volatility potential.
“Ethereum ETFs still lack the structural yield advantage many institutions expected,” BitMEX co-founder Arthur Hayes said in a recent market discussion. “Until staking is integrated into these products, capital allocation will remain skewed toward Bitcoin.”
On-chain data also shows weakening conviction among large holders. According to Glassnode metrics shared by market analysts this week, the number of wallets holding more than 10,000 ETH has fallen to its lowest level in nearly 10 months. Whale distribution phases often increase downside pressure because large holders gradually feed supply into the market during periods of weakening momentum.
Exchange flow data has added to bearish concerns. Net ETH inflows into centralized exchanges recently climbed to their highest levels since early 2025, signaling that more investors may be preparing to sell or hedge their positions. Rising exchange balances generally increase short-term market supply and can intensify volatility during periods of panic selling.
Why is Ethereum price breaking down from its ascending channel?
Technical indicators suggest Ethereum may now be entering a decisive bearish phase after losing support from a multi-month ascending channel visible on the daily chart.
The chart shows ETH breaking below the lower boundary of its ascending channel after repeatedly failing to reclaim resistance near the $2,280 to $2,320 region. The breakdown occurred as price also slipped below the 20-day exponential moving average, a sign that short-term bullish momentum has weakened considerably.
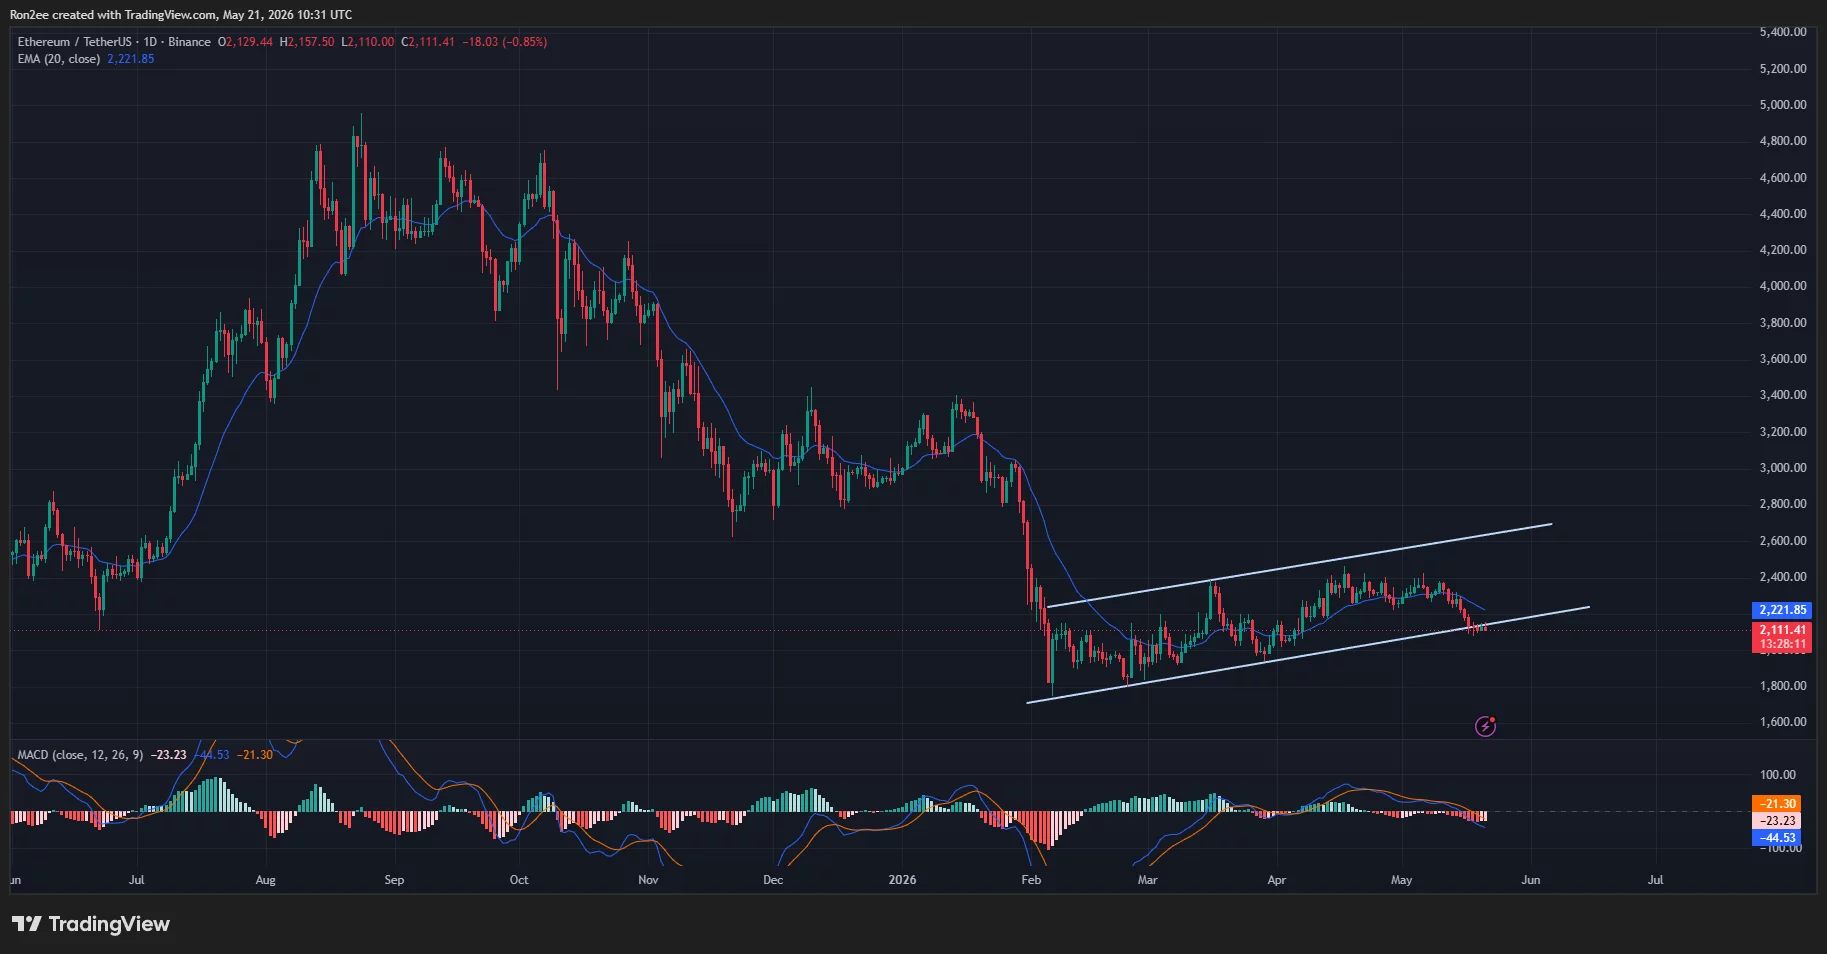
Momentum indicators are also deteriorating. The MACD histogram has flipped negative while the MACD line continues crossing below the signal line, confirming growing bearish momentum on the daily timeframe. Previous bearish crossovers on the same chart structure earlier this year preceded extended downside moves.
The immediate support zone now sits near $2,080. Failure to hold this area could expose Ethereum to a rapid move toward the $1,800 region, which aligns with previous consolidation support formed during March and April.
Some technical traders have also warned that Ethereum is now trading below several major exponential moving averages, strengthening the probability of further downside continuation. A confirmed daily close below the channel support could invalidate the entire April recovery structure.
Derivatives positioning adds another layer of risk. CoinGlass liquidation data shows a dense concentration of leveraged long positions sitting between $2,040 and $2,000. If Ethereum breaks decisively below that zone, forced liquidations could amplify downside volatility.
According to CoinGlass estimates, more than $1.70 billion worth of leveraged long positions could face liquidation pressure if ETH falls below approximately $2,044. Such liquidation cascades often trigger rapid flash crashes as exchanges automatically close overleveraged positions in declining markets.
Funding rates across several major perpetual futures exchanges have also started turning negative, indicating growing bearish sentiment among derivatives traders. Negative funding rates generally suggest short sellers are becoming more aggressive while bullish positioning weakens.
Open interest has simultaneously declined from recent highs, signaling that traders are reducing exposure rather than aggressively buying the dip. Falling open interest during price declines often points to weakening market confidence and fading speculative demand.
What could invalidate the bearish Ethereum thesis?
Despite the deteriorating technical structure, several developments could still prevent Ethereum from sliding below $1,800.
A rebound in spot ETF demand would likely improve market sentiment quickly. Institutional inflows previously helped stabilize ETH during earlier corrections, particularly when BlackRock and Fidelity products experienced strong subscription growth.
Cooling inflation data could also ease pressure on risk assets. Softer U.S. PCE or CPI readings may reduce Treasury yields and revive expectations for Federal Reserve rate cuts later this year. Lower yields generally improve liquidity conditions for speculative markets, including cryptocurrencies.
Geopolitical developments remain another important variable. Oil prices recently stabilized after renewed diplomatic discussions involving Middle East trade corridors and shipping routes. Any major decline in crude prices could improve global risk appetite and reduce inflation concerns that have pressured crypto markets.
Technically, Ethereum would need to reclaim the $2,230 to $2,280 resistance zone to invalidate the immediate bearish setup. A successful recovery above the broken channel support could trap short sellers and potentially trigger a relief rally toward the $2,500 region.
Crypto trader Michaël van de Poppe recently argued that Ethereum still retains long-term upside potential despite short-term weakness. “As long as ETH holds above the macro support region, the bull cycle structure remains intact,” he said in a market update shared on X.
For now, however, momentum remains tilted toward the bears. Unless Ethereum quickly reclaims lost support levels and macro conditions improve, traders may continue preparing for a deeper correction toward the $1,800 area in the sessions ahead.
Disclosure: This article does not represent investment advice. The content and materials featured on this page are for educational purposes only.


You May Also Like

Best Mobile User Retention Tools in 2026

The Chemistry of UV Resistance: How Titanium Dioxide Protects Against the California Sun

Fed Governor Calls For Strong Stablecoin Oversight As CLARITY Act’s Final Text Gets Delayed


