

The halving narrative resonates with liquidity, will the fourth quarter of 2025 become the ultimate bull market carnival?
By Michael Nadeau, The DeFi Report
Compiled by: BitpushNews
Cryptocurrency adoption cycles typically consist of a three-year period of growth expansion, followed by a bear market lasting about a year.
If calculated from the BTC price low in November 2022, the current expansion period has lasted 1,044 days. For reference, the 2021 cycle expansion lasted 1,063 days, and the 2017 cycle was 1,065 days.
By this measure, we are clearly in the “late cycle” of the current expansion phase.
But how do the current data and key indicators compare to those in September 2021?
We will answer this question in this report.
Disclaimer: The views expressed in this article are the author's personal views and should not be used as investment advice.
Realized profit and holding time destruction indicators
Realized profit
According to Glassnode data, BTC investors have realized $857 billion in profits in this cycle - 65% higher than the 2021 cycle.
This phenomenon is within expectations, considering that the higher the BTC price, the more returns long-term investors will gain per cycle.
A standardized way of comparison is to compare realized profits with market capitalization over each period.
The market capitalization at the 2021 cycle peak was $1.26 trillion, with a realized profit-to-market capitalization ratio of 0.41.
BTC’s current market capitalization is $2.28 trillion, and the realized profit to market capitalization ratio for this cycle is currently 0.38.
The conclusion? From a wealth creation perspective, we are now at similar levels to the entire 2021 cycle.
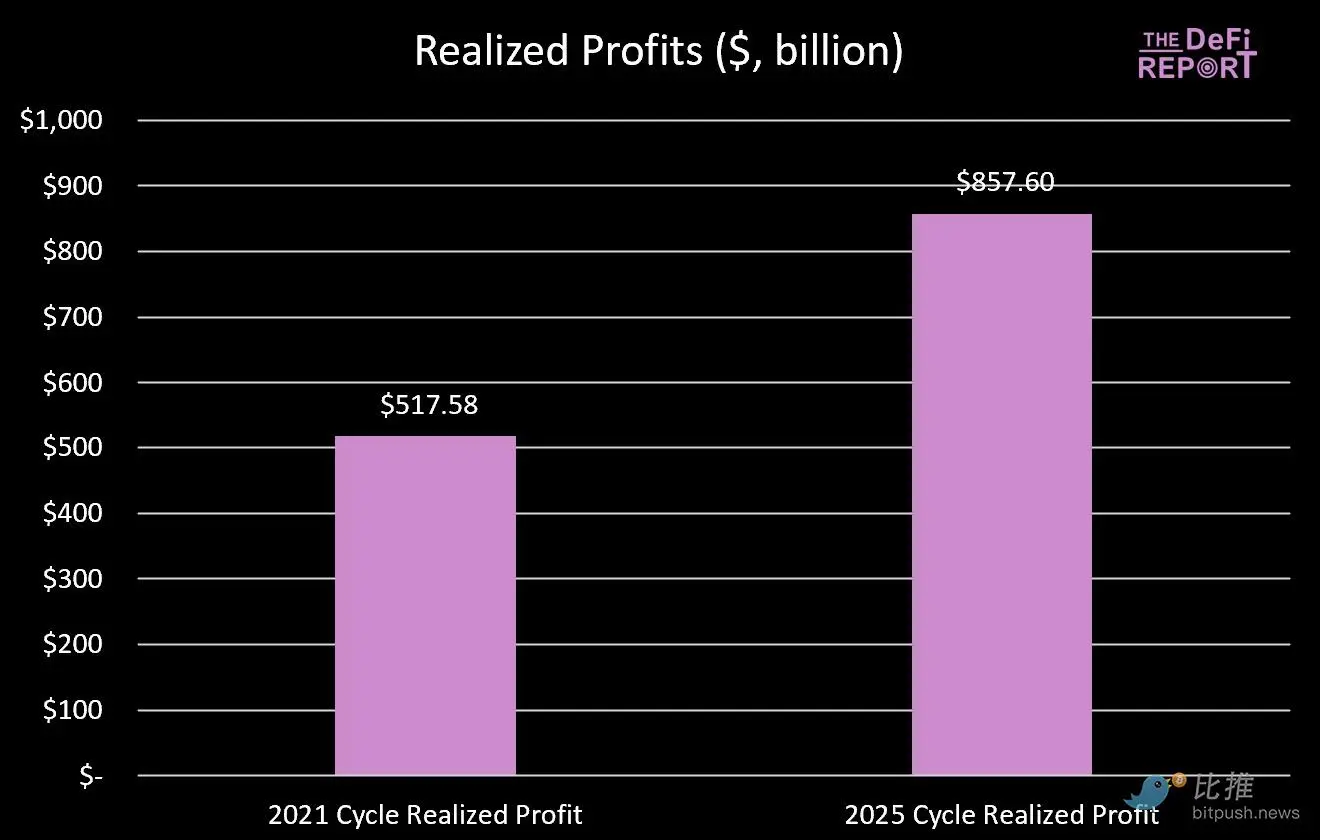
Realized profit data chart
Coin holding time destruction indicator
Another angle to examine profit taking is the "holding time destruction indicator".
As defined by Glassnode, this metric measures the total number of days a token is held before being spent.
As shown in the figure below, the total amount of "coin-day destruction" in this cycle is 15% higher than that in the 2021 cycle.
This also fits the characteristics of the "late cycle".
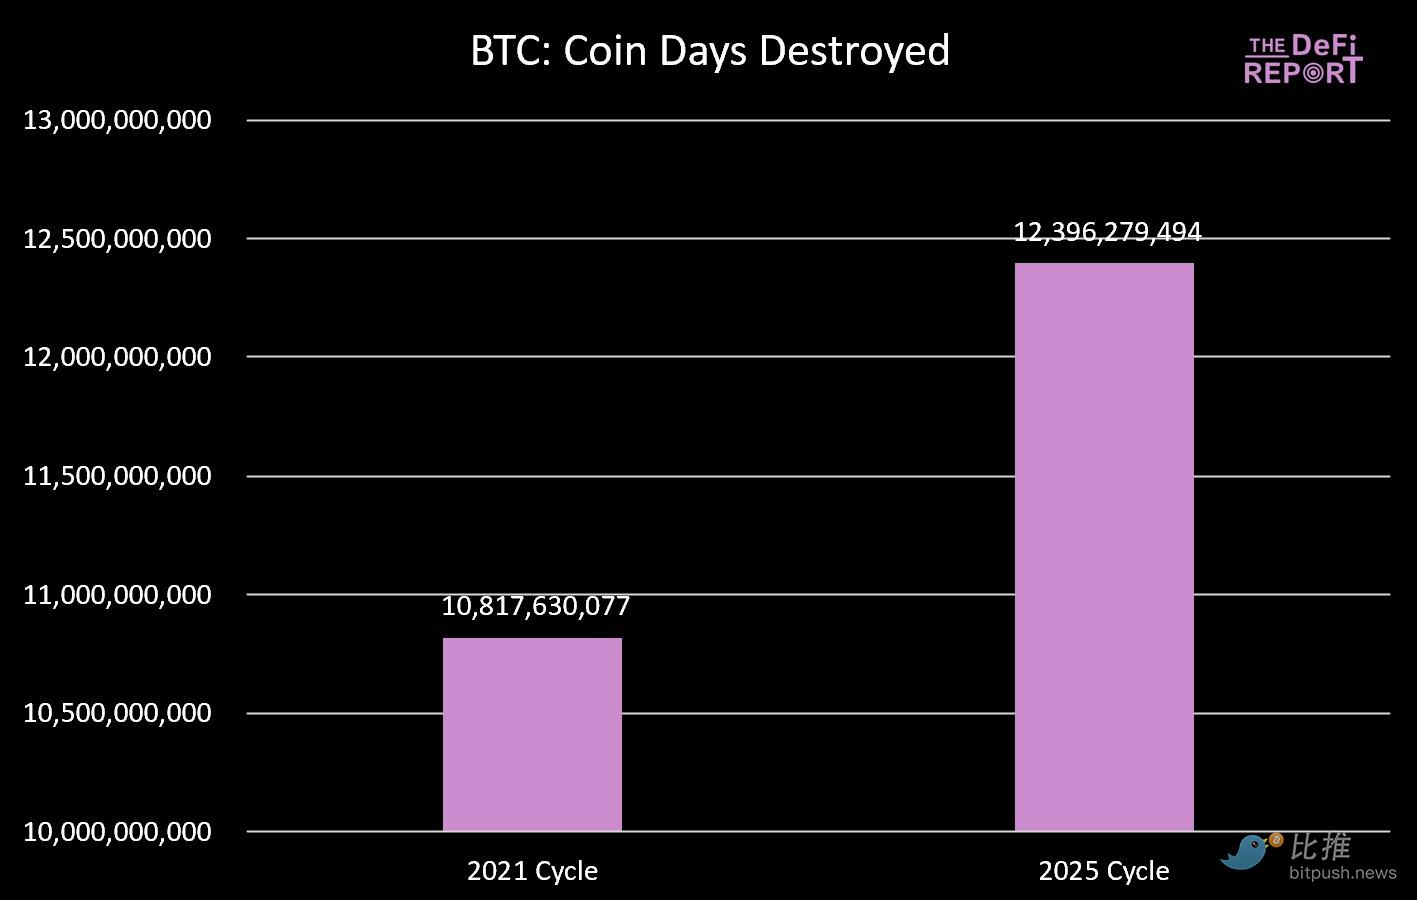
Bitian destruction data chart
Long-term holder supply
The behavior pattern of long-term holders in this cycle is similar to that in the previous cycle.
Between October 2020 and March 2021, long-term holder supply fell by 13.5% (corresponding to the first price peak in April 2021). LT holder supply then rebounded and continued to rise for the remainder of the cycle.
Similarly, from December 2023 to February 2025, the long-term holder supply fell by 12.4%, before recovering to the current level of 73%.
Conclusion: Long-term holders tend to allocate tokens to new funds entering the market. In the 2021 cycle, this happened during the first price peak in April 2021.
In the current cycle, this happened in the fourth quarter of last year and continued into the first quarter of this year.
If we expect a breakout fourth quarter, we need to see new money flowing into the market – something we didn’t see during the same period last cycle.
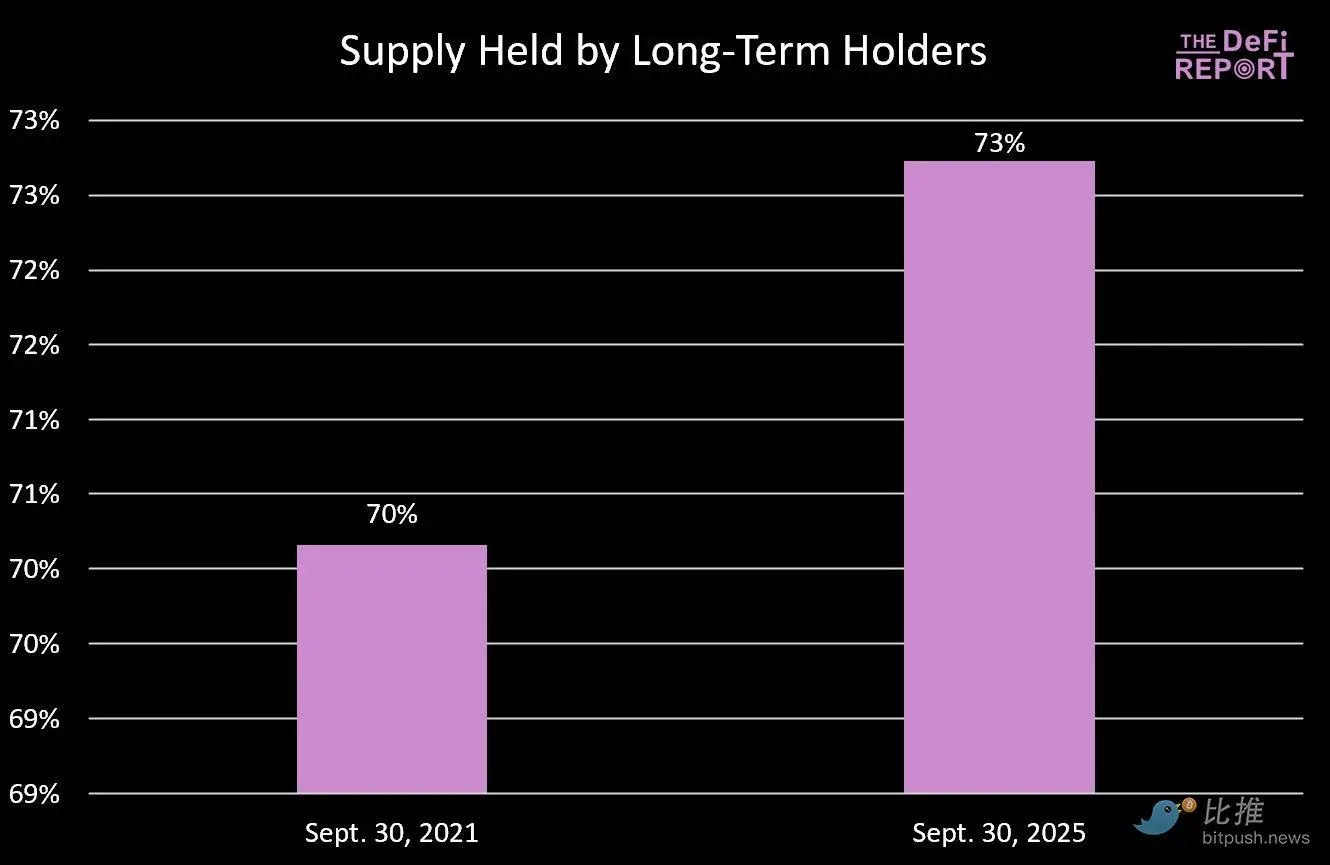
Long-term holder supply data chart
Bitcoin dominance
In the past two cycles, the market peaked when Bitcoin dominance fell to around 40%.
We are nowhere near that level this cycle. We believe there are several reasons for this:
- This cycle of BTC financialization through ETFs and institutional participation
- The maturity of the cryptocurrency market. Last cycle, with the exception of Ethereum, every L1 was a "shiny new toy" for investors to speculate on. Furthermore, NFTs and DeFi were still in their early stages—investors likely significantly overestimated their maturity, use cases, and sustainability. This is no longer the case; the market has matured.
- The 2021 cycle saw significant fiscal and monetary policy support due to COVID, but this momentum is unlikely to repeat itself. When altcoins significantly outperformed BTC, there was little incentive to hold BTC. This is no longer the case, and asset selection is crucial.
We still believe BTC dominance will decline further, but not to the levels seen in the past.
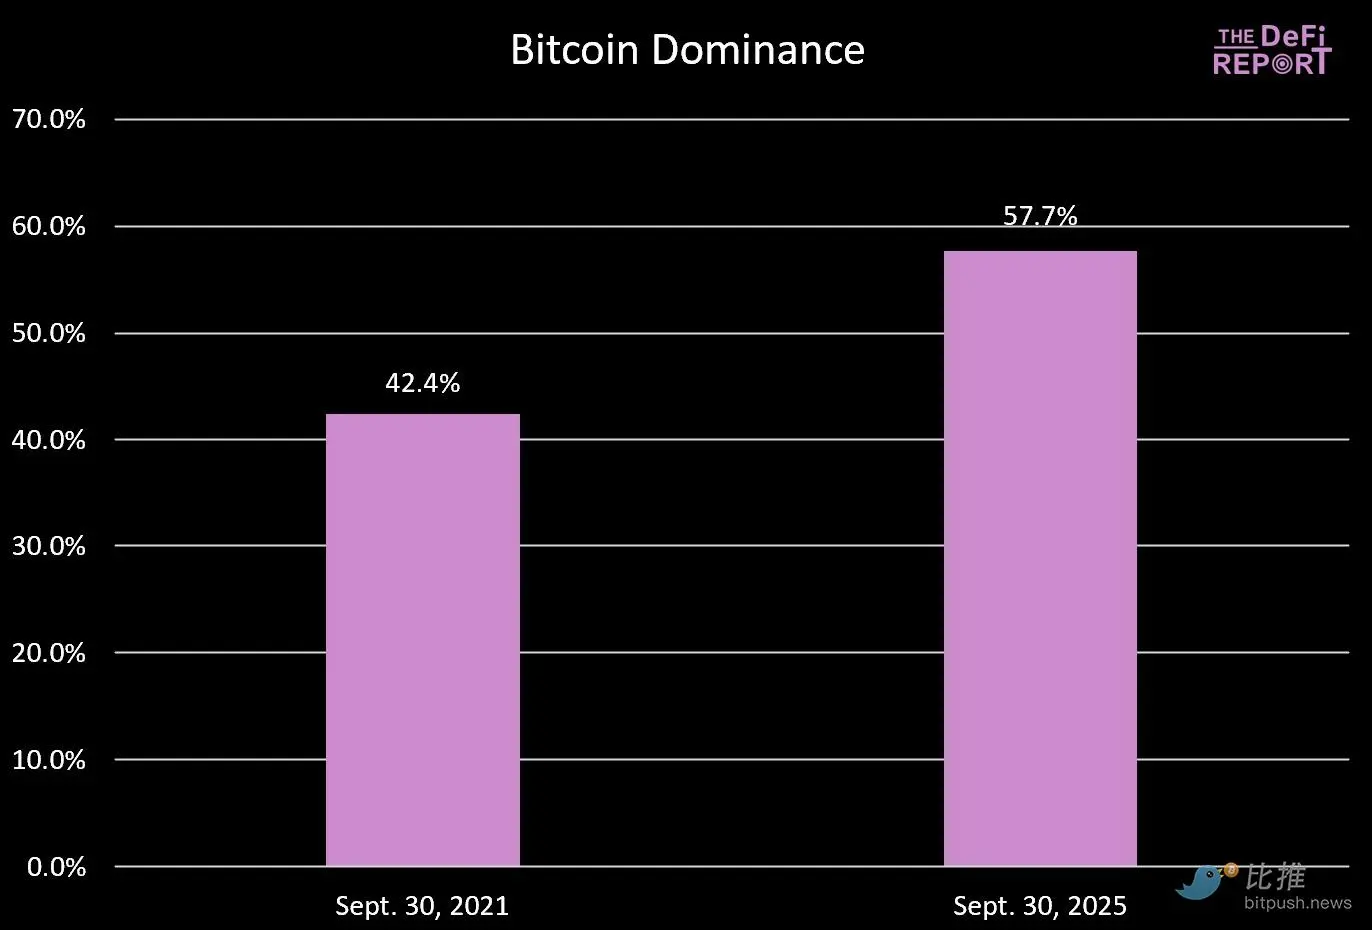
Bitcoin dominance data chart
200-week moving average
We pay close attention to the 200-week moving average for two reasons:
- In a bear market, Bitcoin tends to fall to its 200-week moving average;
- In the past two cycles, Bitcoin peaked when the 200-week moving average converged to the previous cycle high;
The 200-week moving average is currently $53,100.
Will we end up falling to $66,000 (previous cycle high) this year?
This is unlikely, as our estimates suggest that even a sharp 40% rally in the coming months would place the 200-week moving average in the $57,000 range. Of course, a return to those levels is possible if the cycle continues into next year.
Conclusion: As the cycle progresses, the law of diminishing returns is becoming apparent, as shown in the figure below.
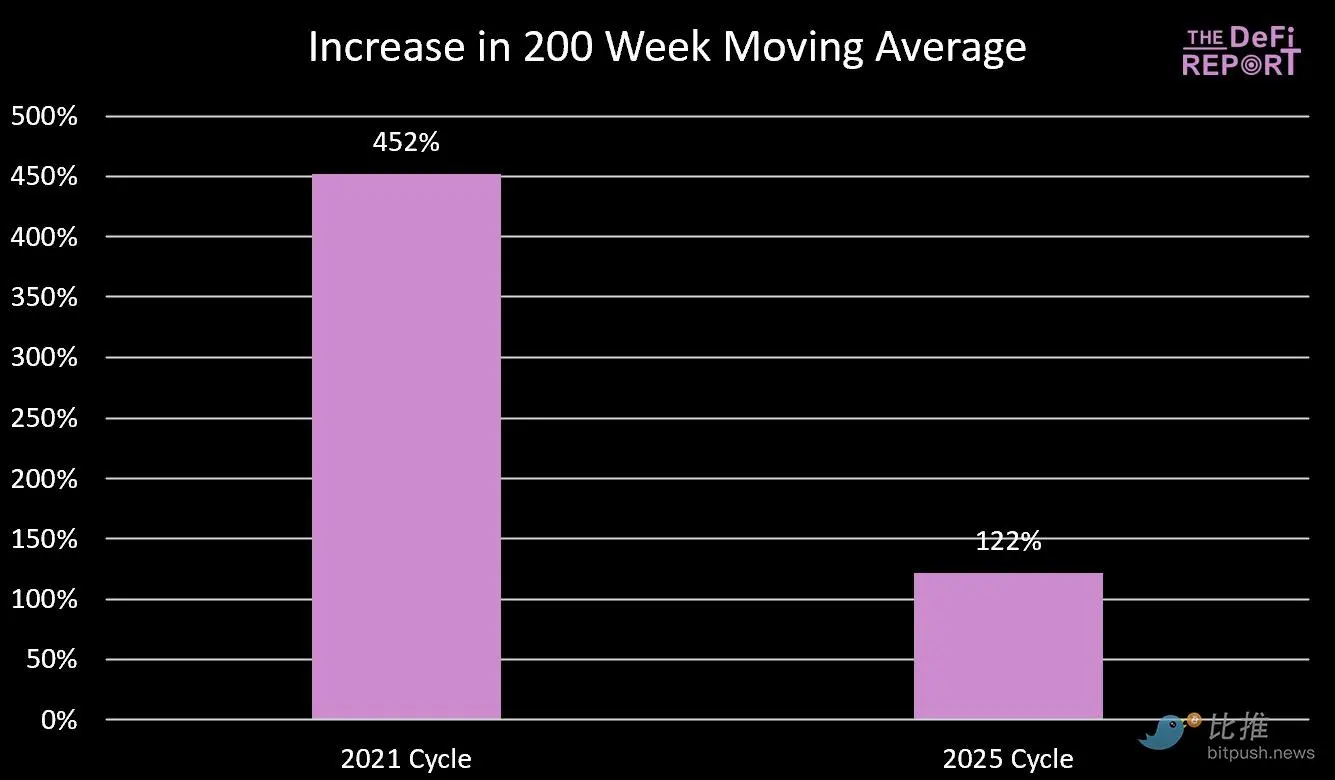
200-week moving average data chart
Realized Price and MVRV-Z Score
Realized Price
According to Glassnode data, Bitcoin’s realized price (which represents the cost basis of all coins on the network) is currently $53,800.
Similar to the 200-week moving average, Bitcoin tends to revert to its realized price in bear markets, and cycles typically top out when realized price reaches a level consistent with the previous cycle high.
Similar to the 200-week moving average, we do not expect the indicator to reach the previous cycle high this year - further highlighting the law of diminishing returns.
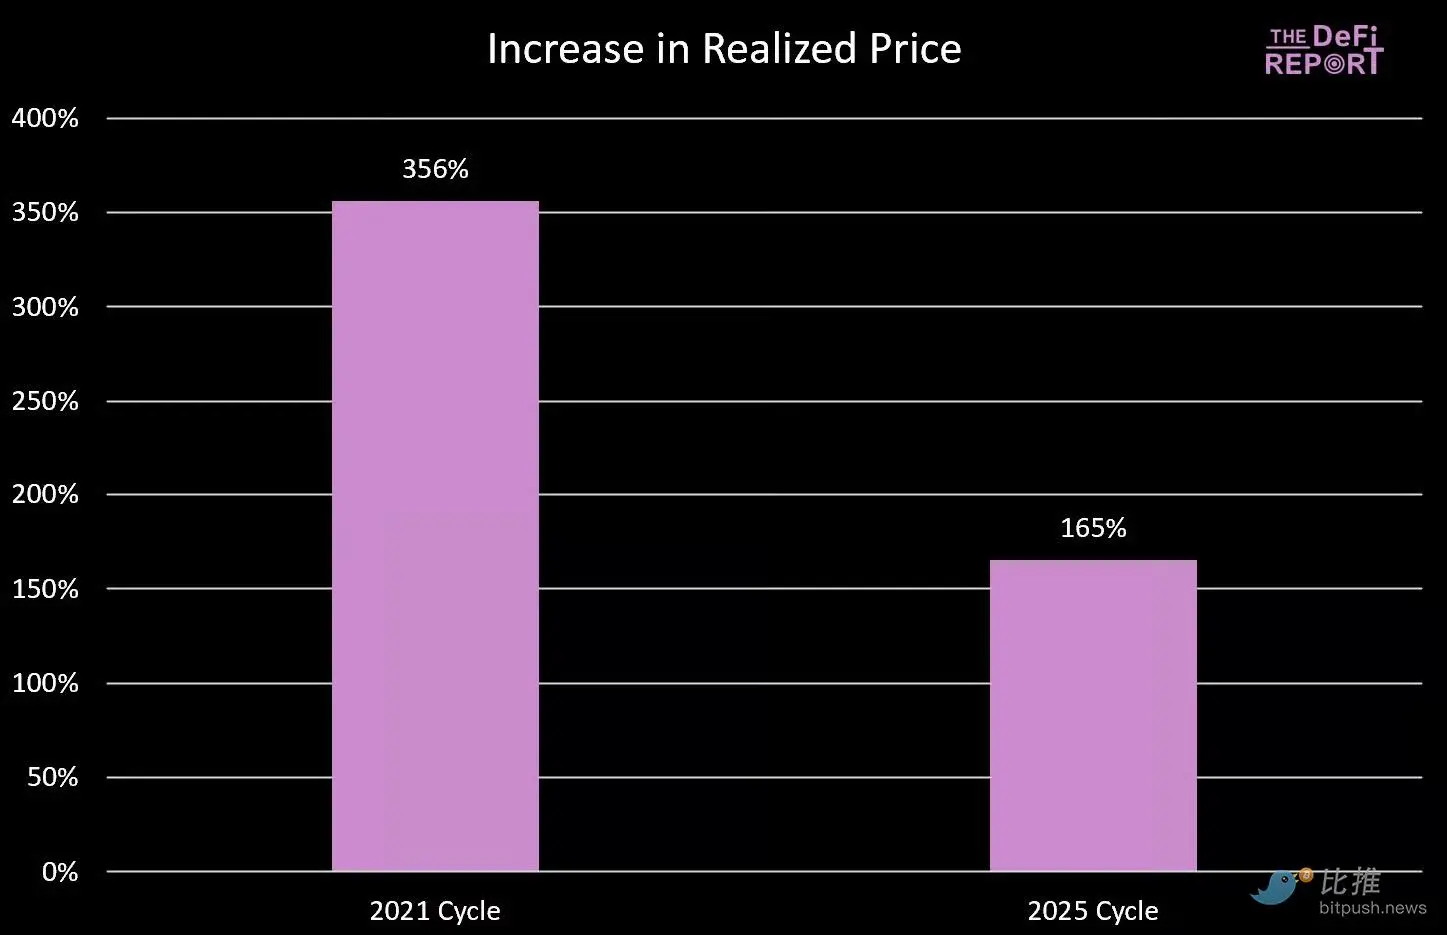
Realized Price Data Chart
MVRV-Z score
The MVRV-Z score measures the extent to which Bitcoin’s market capitalization is “stretched” relative to its realized value via a z-score, adjusted for historical volatility.
The current reading of 2.28 indicates that Bitcoin's market capitalization, relative to its cost basis, has deviated by approximately 2.28 standard deviations from its historical norm.
Interestingly, we are now at a higher level than at the same point in the 2021 cycle, when Bitcoin rallied approximately 50% in October/November, ending the cycle with an MVRV-Z score of 3.49.
If the indicator approaches 3 in this cycle, the BTC price may reach the $160,000 to $170,000 range (a 40-50% increase).

MVRV-Z score data chart
Fear and Greed Index
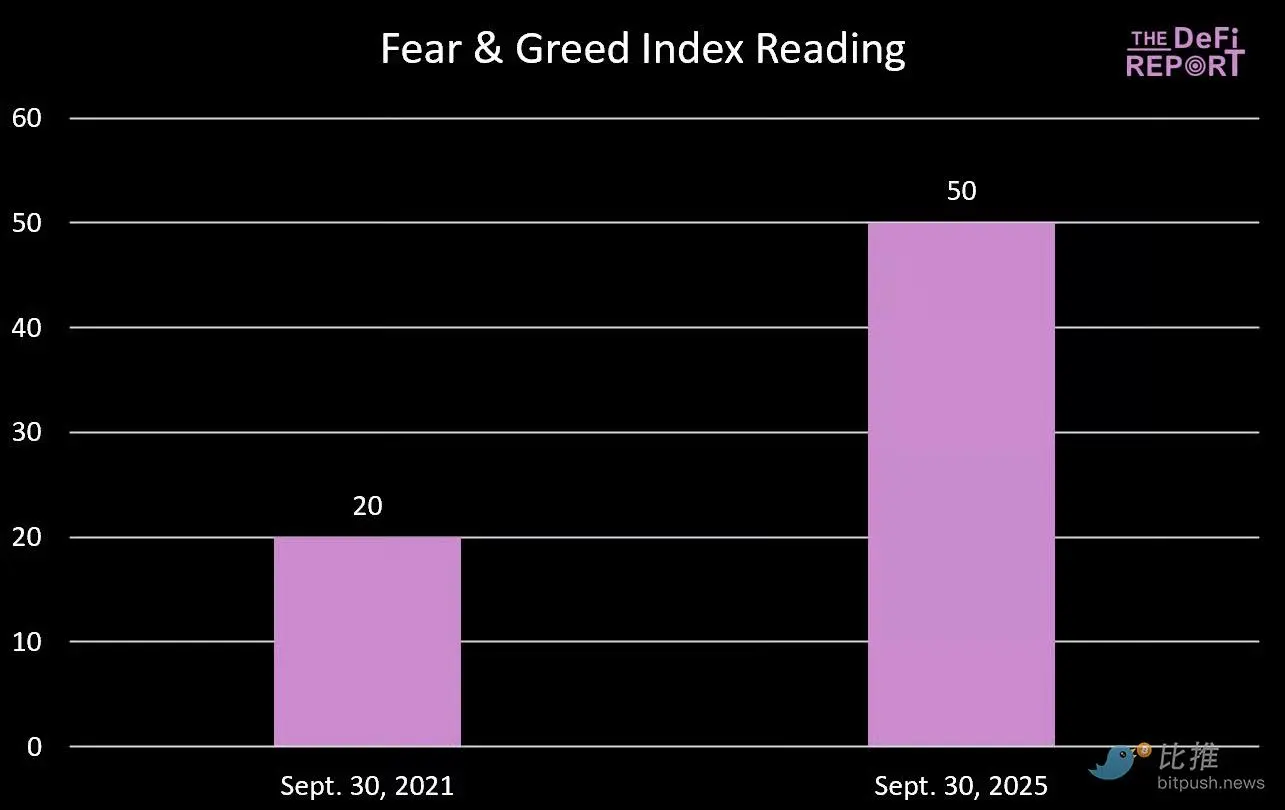
Fear and Greed Index data chart
If you think the market is jittery right now, it was even more panicky during the same period in 2021. In fact, we were in a state of extreme fear in September 2021. BTC had just corrected 20% to $43,000 before rallying to a peak of $66,000 (a 53% increase) over the next five weeks.
Summary and Outlook
There is no law that requires Bitcoin to continue on the “four-year cycle” path we have historically followed.
But after carefully studying the data, it is difficult to deny the possibility of a peak in the fourth quarter.
Why?
We believe the four-year cycle framework is here to stay for several reasons:
- Narrative anchoring. Investors anticipate a "post-halving bull run," which influences investor positioning, crypto-native companies' marketing cycles, and media coverage. Reflexivity makes this pattern self-fulfilling.
- Liquidity and the credit cycle. The halving cycle has historically coincided with the global debt refinancing cycle, amplifying the liquidity needed to generate a crypto bull run.
- The mechanics of the four-year halving cycle and its impact on miner operations tightens supply just as demand tends to return to the market.
- Product/Innovation Cadence. Venture capital tends to fund the industry based on liquidity cycles that align with the four-year halving cycle. These projects take time to enter the market, while new innovations and narratives emerge in bursts, amplifying the cryptocurrency adoption cycle.
- Volatility. Investors anticipate a deep bear market in the crypto market, allowing them to purchase their desired assets at a discount. This naturally drives profit-taking, creating a self-reinforcing feedback loop.
- Based on the observed data and the entrenchment of these qualitative/behavioral factors, our base case is that BTC will peak again in Q4.


You May Also Like

Critical Security Upgrade Halts Cardano Transactions

US Dollar Index strengthens above 100.00 on upbeat US NFP, geopolitical risks


