TLDR: Bitcoin trades at $118,223, down 1.88% in 24 hours, as tariffs reignite global trade tension and slow capital flow. Trump’s tariff threat triggers inflation fears, forcing investors to rotate from risk assets like crypto to safer holdings. Analysts view the $116K–$118K zone as key BTC support, often marking the point where stronger buyers return. [...] The post Here’s Why Bitcoin (BTC) Price Is Dumping appeared first on Blockonomi.TLDR: Bitcoin trades at $118,223, down 1.88% in 24 hours, as tariffs reignite global trade tension and slow capital flow. Trump’s tariff threat triggers inflation fears, forcing investors to rotate from risk assets like crypto to safer holdings. Analysts view the $116K–$118K zone as key BTC support, often marking the point where stronger buyers return. [...] The post Here’s Why Bitcoin (BTC) Price Is Dumping appeared first on Blockonomi.

Here’s Why Bitcoin (BTC) Price Is Dumping

TLDR:

  • Bitcoin trades at $118,223, down 1.88% in 24 hours, as tariffs reignite global trade tension and slow capital flow.
  • Trump’s tariff threat triggers inflation fears, forcing investors to rotate from risk assets like crypto to safer holdings.
  • Analysts view the $116K–$118K zone as key BTC support, often marking the point where stronger buyers return.
  • Market recovery depends on softer tariff tone or Fed easing, both of which could restore crypto liquidity and confidence.

Bitcoin’s price is sliding fast, and traders are feeling the pressure. The world’s largest crypto asset has fallen as renewed trade tensions shake global markets. 

U.S. tariff plans on Chinese goods have rattled investors, triggering risk aversion across major assets. Liquidity is tightening, leverage is unwinding, and crypto is catching the heat first. Market watchers say the drop may deepen before any recovery takes hold.

Tariff Shock Sends Crypto Markets Lower

According to Bull Theory on X, Bitcoin’s sharp decline comes as former U.S. President Donald Trump announced plans for heavy tariffs and export controls on Chinese goods. 

The move targets key industrial materials and renews fears of disrupted supply chains. As inflation risks rise, liquidity conditions have worsened, pressuring risk assets like crypto.

Investors are rotating out of volatile holdings and moving into safer assets such as gold and cash. The shift is visible across trading desks as leveraged crypto positions unwind quickly. 

Analysts say this rotation is a standard reaction when inflation expectations climb and monetary policy easing appears less likely.

Past tariff tensions have hit BTC and altcoins in similar ways. During the 2025 trade standoff, the market saw steep liquidations followed by weeks of choppy recovery. This pattern, traders note, often tests market depth before stronger hands re-enter.

CoinGecko data shows Bitcoin trading at $118,223, reflecting a 1.88% decline in the last 24 hours and 3.7% over the past week. The selling pressure aligns with global equity weakness and slowing capital inflows into crypto exchanges.

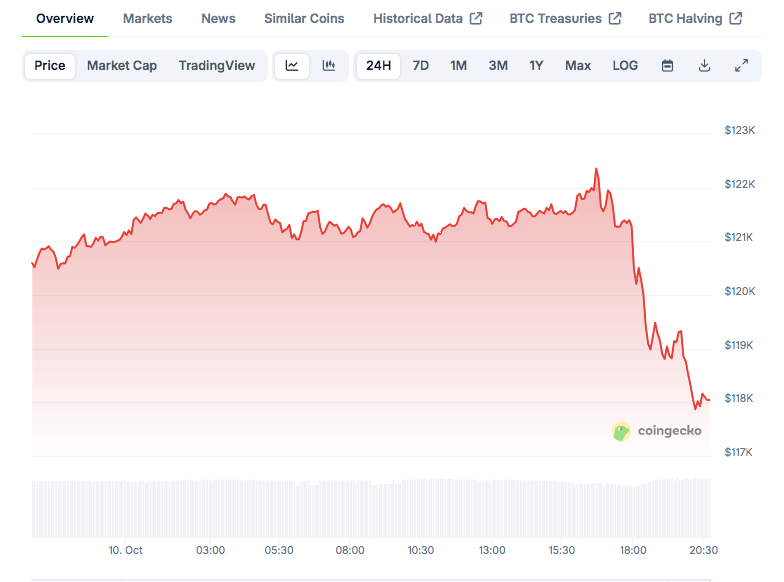
Bitcoin price on CoinGecko

Bitcoin Price Outlook: Key Levels and What Comes Next

Market watchers are now eyeing the $116,000 to $118,000 zone as potential short-term support. 

Bull Theory pointed out that buyers have historically stepped in near these levels during high-volatility periods. If the zone holds, a short-term bounce could form once sentiment steadies.

However, traders remain cautious as policy uncertainty persists. Any delay in expected rate cuts could keep liquidity tight and extend the correction. Analysts suggest that funding rates, open interest, and stablecoin flows will be key indicators for the next move.

If tariff rhetoric softens or the Federal Reserve signals easing, market sentiment could flip quickly. In that case, accumulation may resume as investors reposition for Q4, historically one of Bitcoin’s stronger periods. 

Despite near-term stress, long-term traders remain confident in crypto’s resilience once liquidity returns.

The post Here’s Why Bitcoin (BTC) Price Is Dumping appeared first on Blockonomi.

Market Opportunity
WHY Logo
WHY Price(WHY)
$0.00000001515
$0.00000001515$0.00000001515
-0.19%
USD
WHY (WHY) Live Price Chart
Disclaimer: The articles reposted on this site are sourced from public platforms and are provided for informational purposes only. They do not necessarily reflect the views of MEXC. All rights remain with the original authors. If you believe any content infringes on third-party rights, please contact service@support.mexc.com for removal. MEXC makes no guarantees regarding the accuracy, completeness, or timeliness of the content and is not responsible for any actions taken based on the information provided. The content does not constitute financial, legal, or other professional advice, nor should it be considered a recommendation or endorsement by MEXC.

You May Also Like

Microsoft Corp. $MSFT blue box area offers a buying opportunity

Microsoft Corp. $MSFT blue box area offers a buying opportunity

The post Microsoft Corp. $MSFT blue box area offers a buying opportunity appeared on BitcoinEthereumNews.com. In today’s article, we’ll examine the recent performance of Microsoft Corp. ($MSFT) through the lens of Elliott Wave Theory. We’ll review how the rally from the April 07, 2025 low unfolded as a 5-wave impulse followed by a 3-swing correction (ABC) and discuss our forecast for the next move. Let’s dive into the structure and expectations for this stock. Five wave impulse structure + ABC + WXY correction $MSFT 8H Elliott Wave chart 9.04.2025 In the 8-hour Elliott Wave count from Sep 04, 2025, we saw that $MSFT completed a 5-wave impulsive cycle at red III. As expected, this initial wave prompted a pullback. We anticipated this pullback to unfold in 3 swings and find buyers in the equal legs area between $497.02 and $471.06 This setup aligns with a typical Elliott Wave correction pattern (ABC), in which the market pauses briefly before resuming its primary trend. $MSFT 8H Elliott Wave chart 7.14.2025 The update, 10 days later, shows the stock finding support from the equal legs area as predicted allowing traders to get risk free. The stock is expected to bounce towards 525 – 532 before deciding if the bounce is a connector or the next leg higher. A break into new ATHs will confirm the latter and can see it trade higher towards 570 – 593 area. Until then, traders should get risk free and protect their capital in case of a WXY double correction. Conclusion In conclusion, our Elliott Wave analysis of Microsoft Corp. ($MSFT) suggested that it remains supported against April 07, 2025 lows and bounce from the blue box area. In the meantime, keep an eye out for any corrective pullbacks that may offer entry opportunities. By applying Elliott Wave Theory, traders can better anticipate the structure of upcoming moves and enhance risk management in volatile markets. Source: https://www.fxstreet.com/news/microsoft-corp-msft-blue-box-area-offers-a-buying-opportunity-202509171323
Share
BitcoinEthereumNews2025/09/18 03:50
DOGE ETF Hype Fades as Whales Sell and Traders Await Decline

DOGE ETF Hype Fades as Whales Sell and Traders Await Decline

The post DOGE ETF Hype Fades as Whales Sell and Traders Await Decline appeared on BitcoinEthereumNews.com. Leading meme coin Dogecoin (DOGE) has struggled to gain momentum despite excitement surrounding the anticipated launch of a US-listed Dogecoin ETF this week. On-chain data reveals a decline in whale participation and a general uptick in coin selloffs across exchanges, hinting at the possibility of a deeper price pullback in the coming days. Sponsored Sponsored DOGE Faces Decline as Whales Hold Back, Traders Sell The market is anticipating the launch of Rex-Osprey’s Dogecoin ETF (DOJE) tomorrow, which is expected to give traditional investors direct exposure to Dogecoin’s price movements.  However, DOGE’s price performance has remained muted ahead of the milestone, signaling a lack of enthusiasm from traders. According to on-chain analytics platform Nansen, whale accumulation has slowed notably over the past week. Large investors, with wallets containing DOGE coins worth more than $1 million, appear unconvinced by the ETF narrative and have reduced their holdings by over 4% in the past week.  For token TA and market updates: Want more token insights like this? Sign up for Editor Harsh Notariya’s Daily Crypto Newsletter here. Dogecoin Whale Activity. Source: Nansen When large holders reduce their accumulation, it signals a bearish shift in market sentiment. This reduced DOGE demand from significant players can lead to decreased buying pressure, potentially resulting in price stagnation or declines in the near term. Sponsored Sponsored Furthermore, DOGE’s exchange reserve has risen steadily in the past week, suggesting that more traders are transferring DOGE to exchanges with the intent to sell. As of this writing, the altcoin’s exchange balance sits at 28 billion DOGE, climbing by 12% in the past seven days. DOGE Balance on Exchanges. Source: Glassnode A rising exchange balance indicates that holders are moving their assets to trading platforms to sell rather than to hold. This influx of coins onto exchanges increases the available supply in…
Share
BitcoinEthereumNews2025/09/18 05:07
The Digital WOW Explains How AI Is Affecting Digital Marketing

The Digital WOW Explains How AI Is Affecting Digital Marketing

WEST PALM BEACH, Fla., Dec. 19, 2025 /PRNewswire/ — The Digital WOW, powered by ConsultPR.net, announces new findings on how AI is affecting digital marketing.
Share
AI Journal2025/12/19 17:30