The Math Behind Blockchain Scheduling and Transaction Fee Mechanisms

Table of Links
Abstract and 1. Introduction
1.1 Our Approach
1.2 Our Results & Roadmap
1.3 Related Work
-
Model and Warmup and 2.1 Blockchain Model
2.2 The Miner
2.3 Game Model
2.4 Warm Up: The Greedy Allocation Function
-
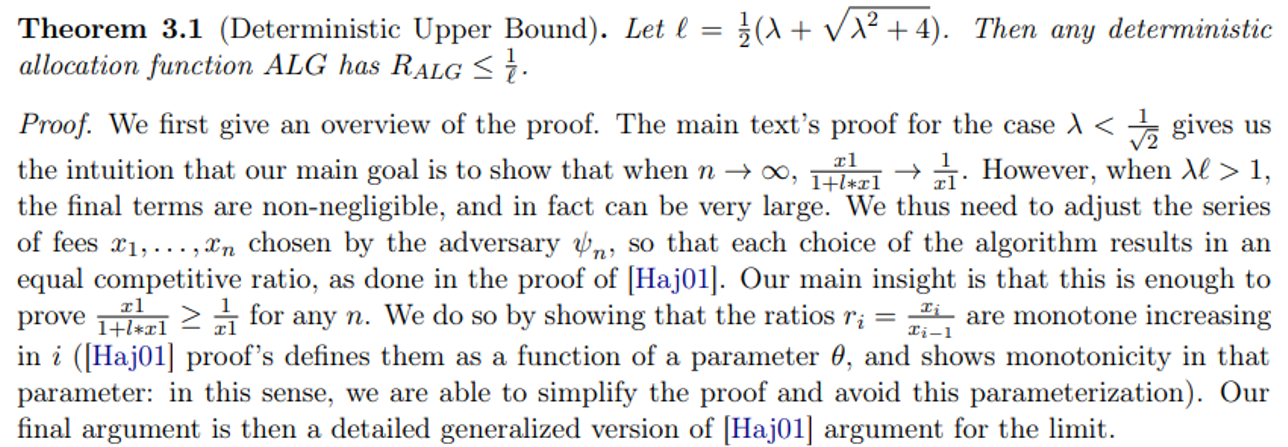
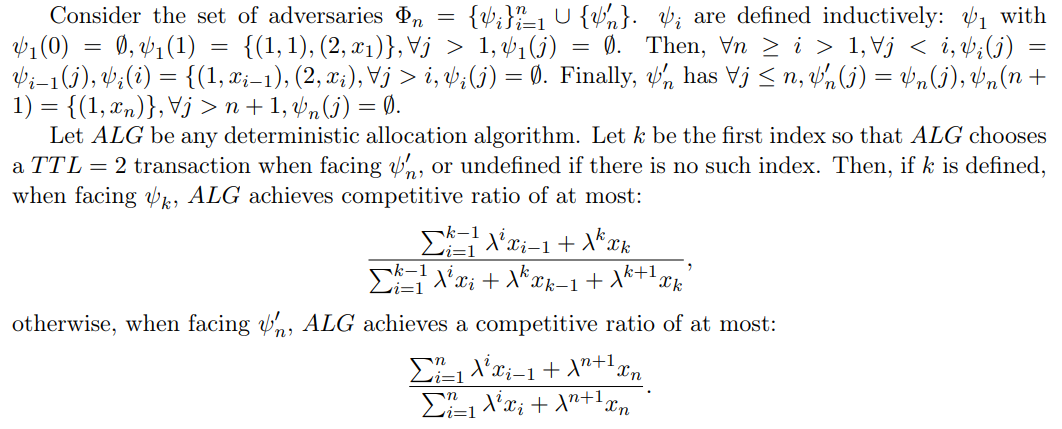
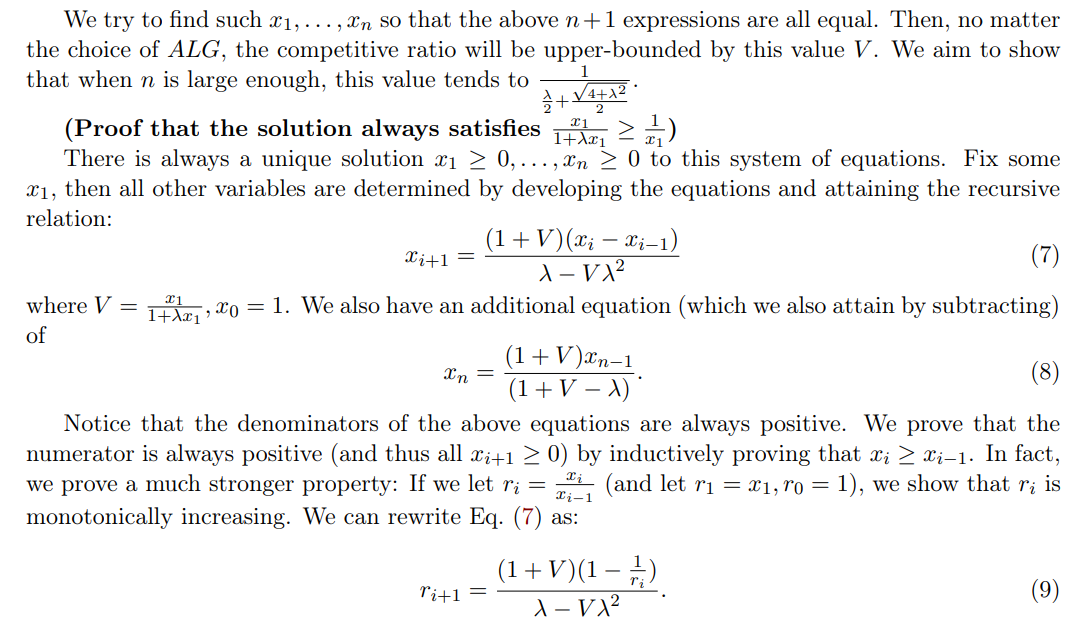
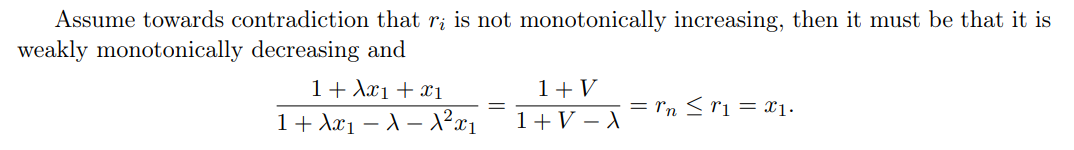
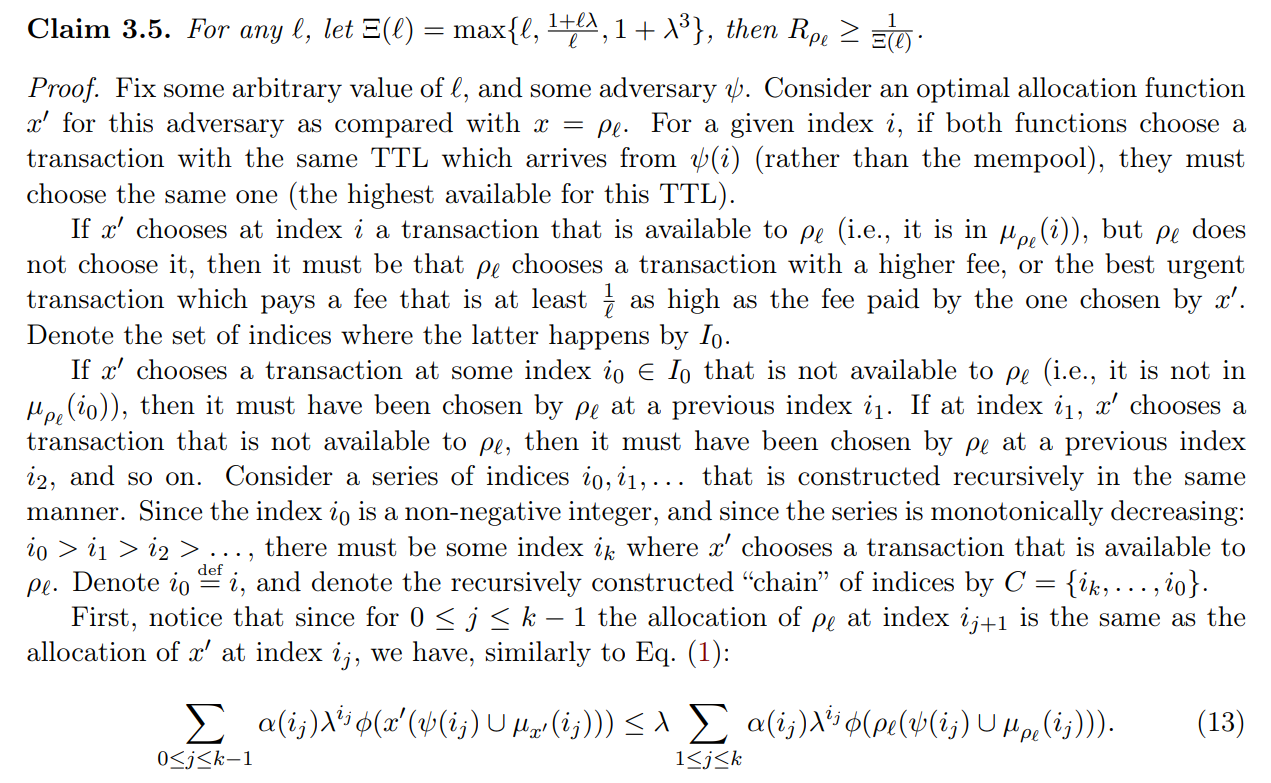
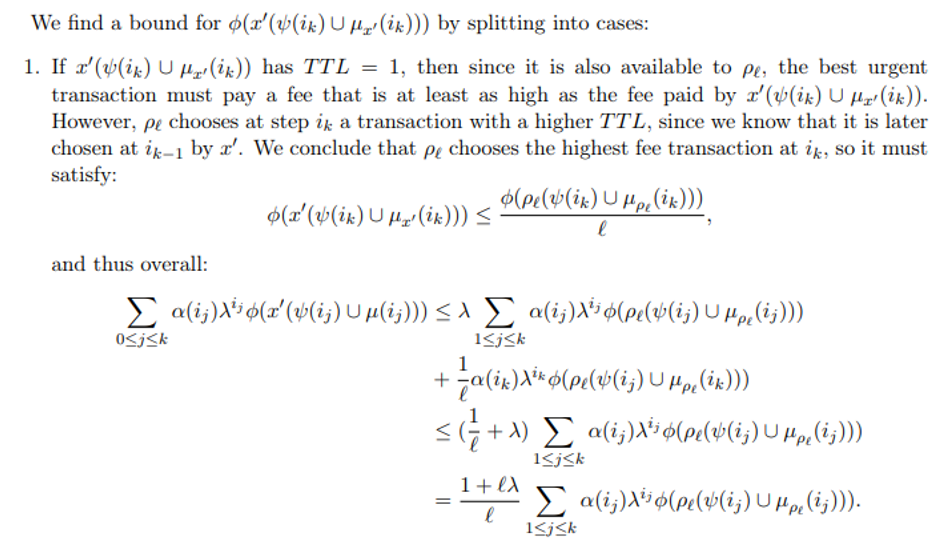
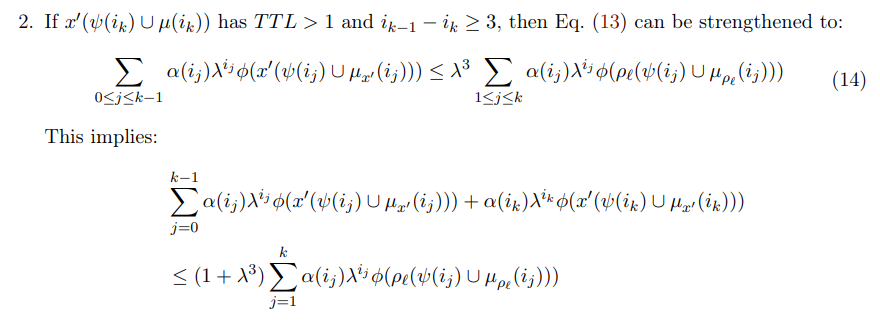
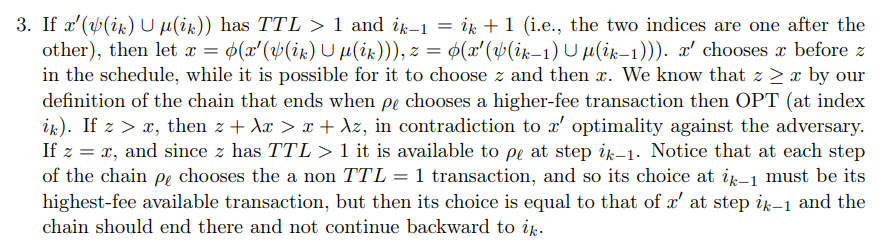
The Deterministic Case and 3.1 Deterministic Upper Bound
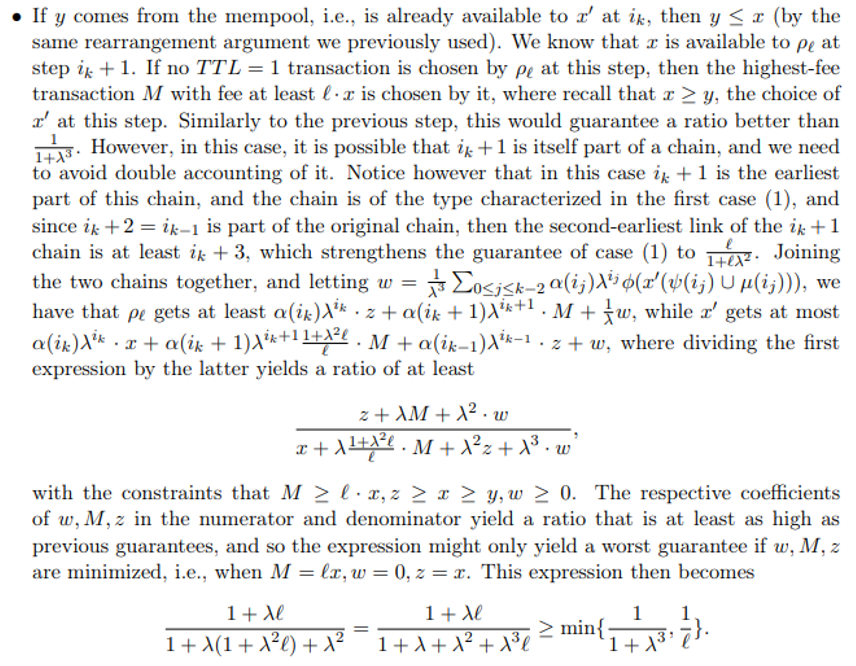
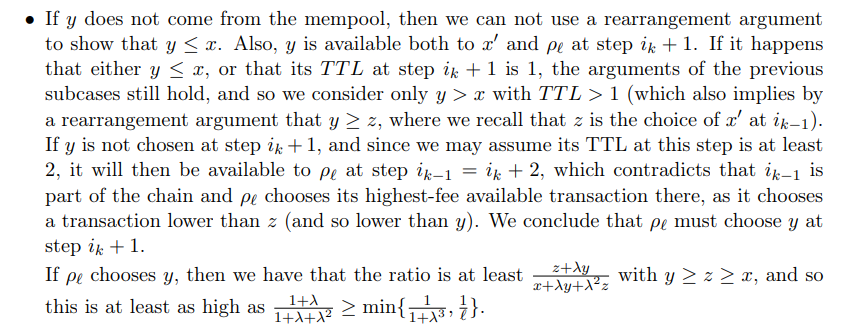
3.2 The Immediacy-Biased Class Of Allocation Function
-
The Randomized Case
-
Discussion and References
- A. Missing Proofs for Sections 2, 3
- B. Missing Proofs for Section 4
- C. Glossary
\
A: Missing Proofs for Sections 2, 3
\ 
\ \ \ 
\ \ \ 
\ \ \ 
\ \ \ 
\ \ \ 
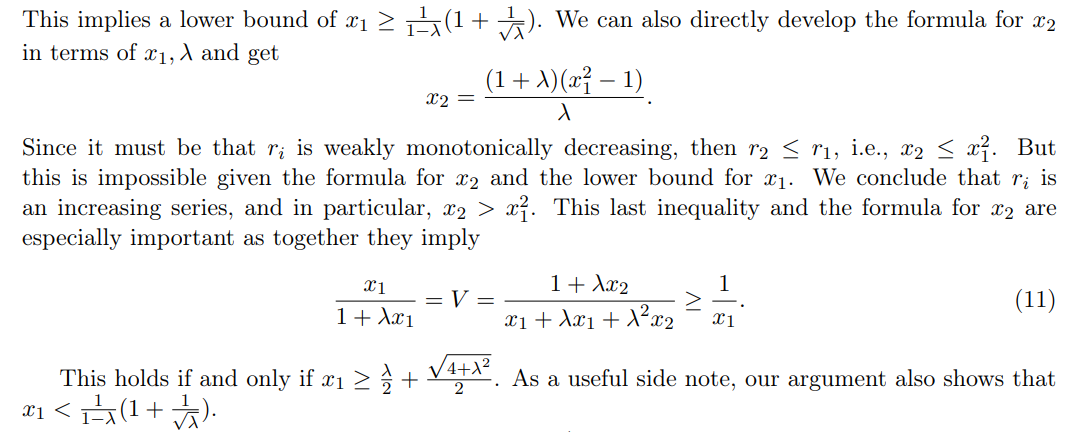
\ \ We now note that a few facts that hold true for any n when x1 ≥ ℓ + ϵ:
\ \ 
\ \ \ 
\ \ \ 
\ \ \ 
\ \ \ 
\ \ \ 
\ \ \ 
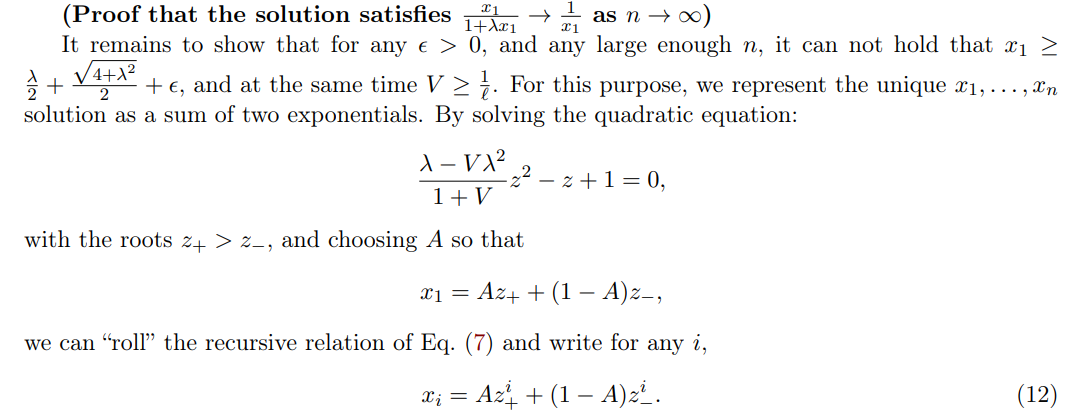
\ \ We separate to several subcases:
\ \ 
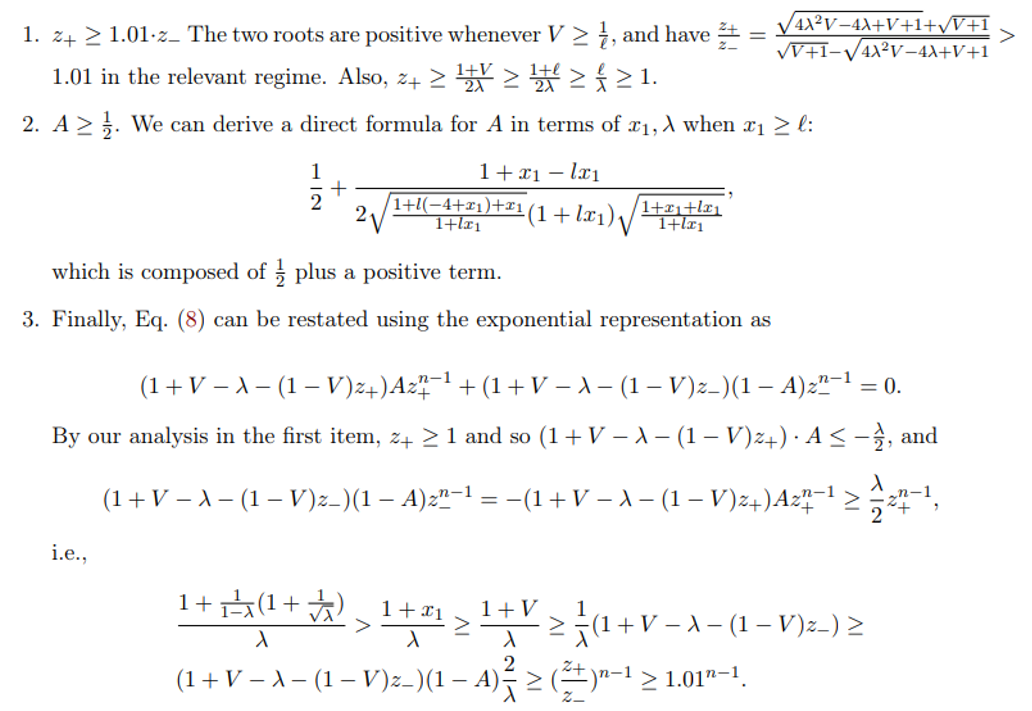
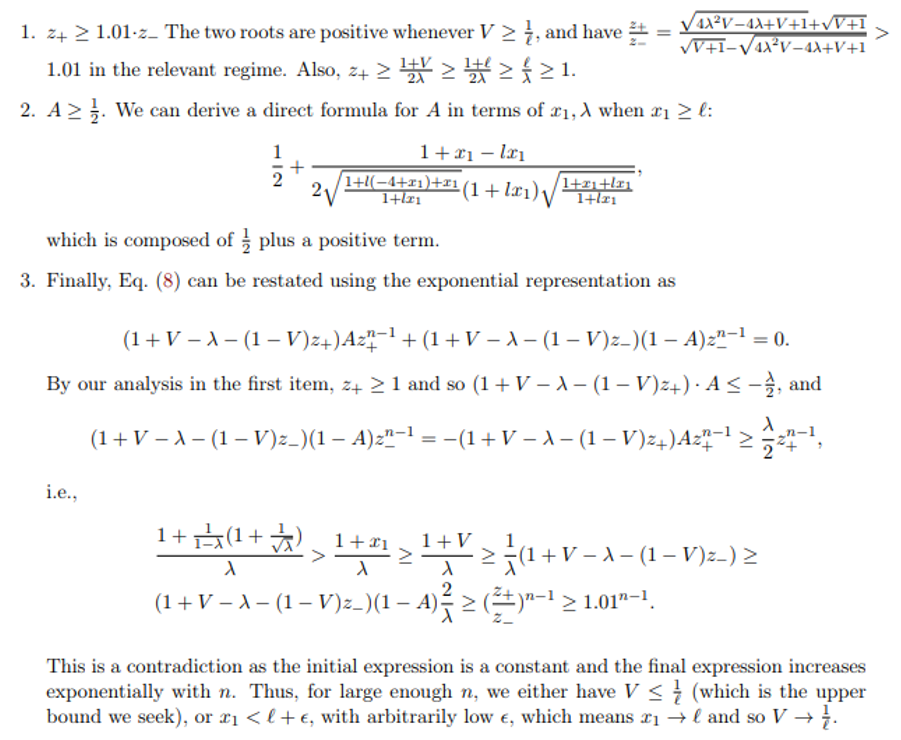
\ \ \ 
\ \ \ 
\ \ \ 
\ \ \ 
\ \ \ 
\ \
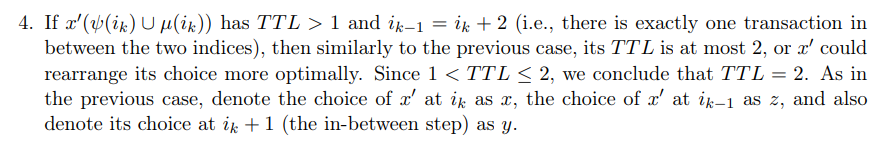
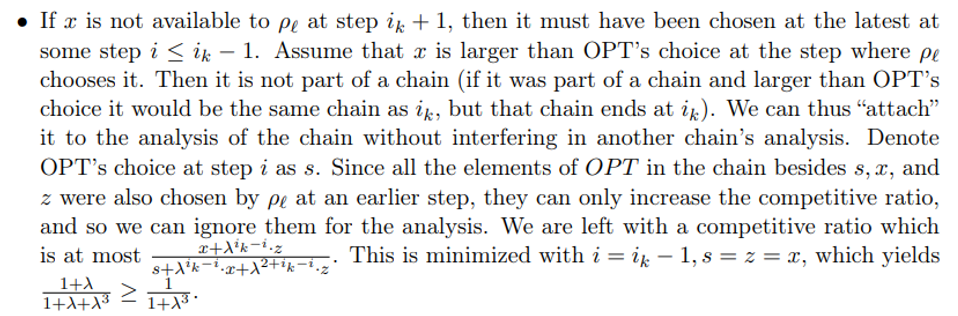
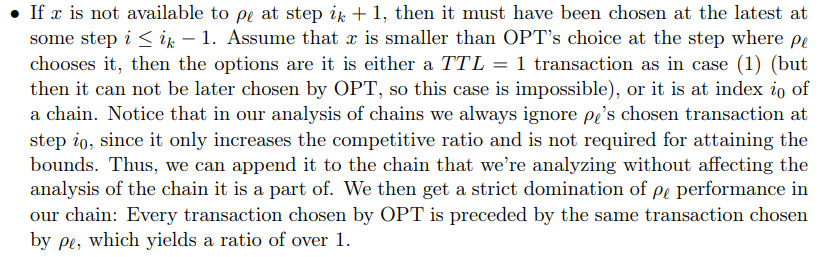
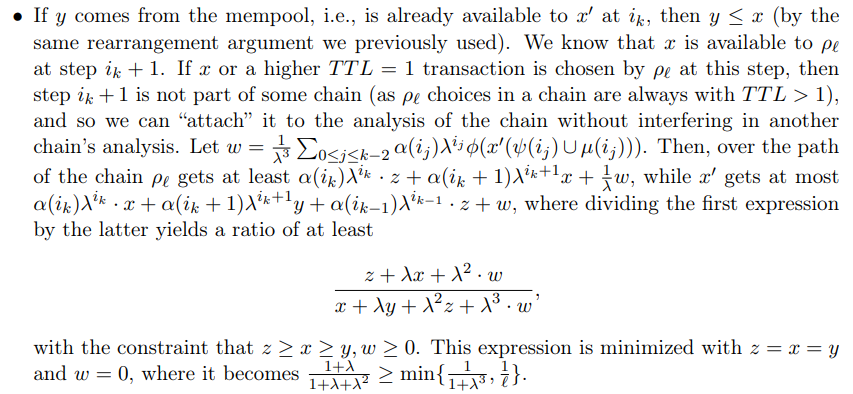
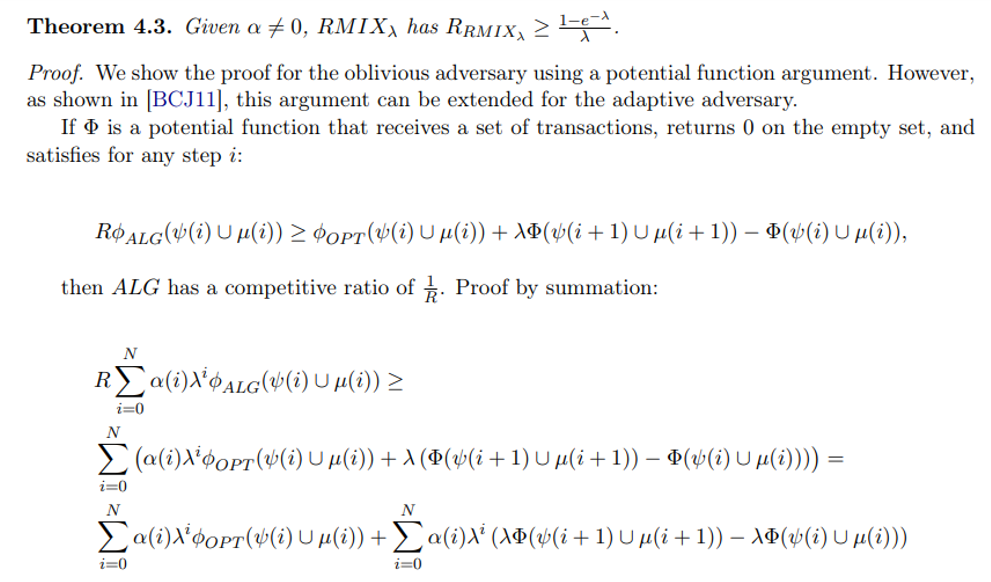
B Missing Proofs for Section 4
\ We now compare ALG and ADV ’s performance in different steps along the adversary schedule, separating the steps before n and the last two steps.
\ Step i < n.
\ ALG expected performance:
\ 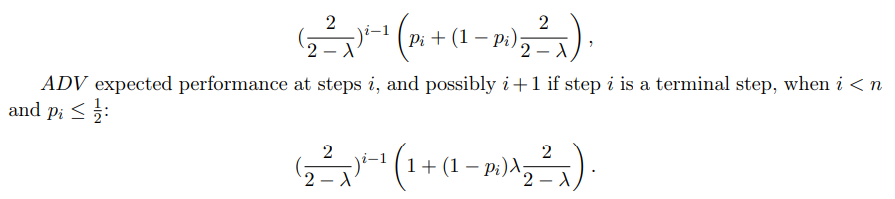
\ Notice that this amortization of considering the i + 1 is only relevant for ADV, as ALG in such case necessarily has no transactions remaining to choose from at step i + 1.
\ 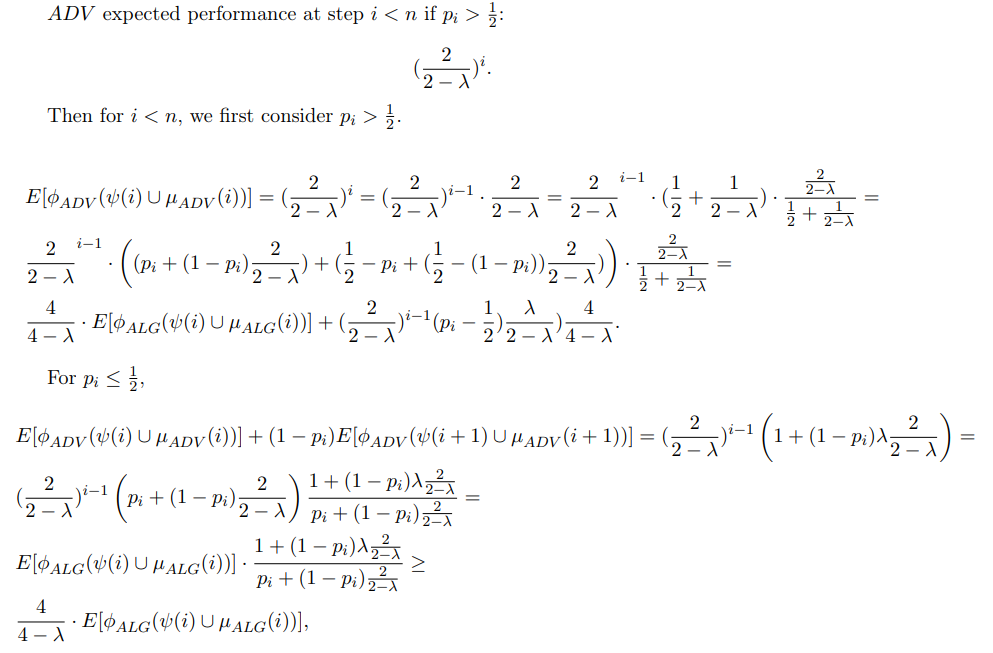
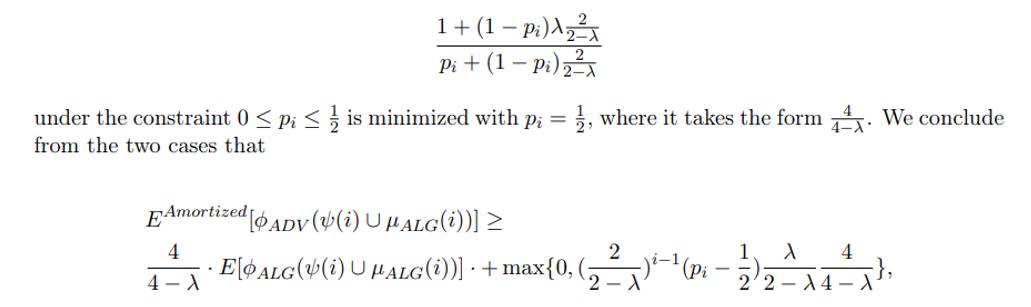
\ where the last transition is since for any 0 ≤ λ ≤ 1, the expression
\ 
\ We now move on to analyze steps n, n + 1.
\ ALG expected performance at step n, n + 1:
\ 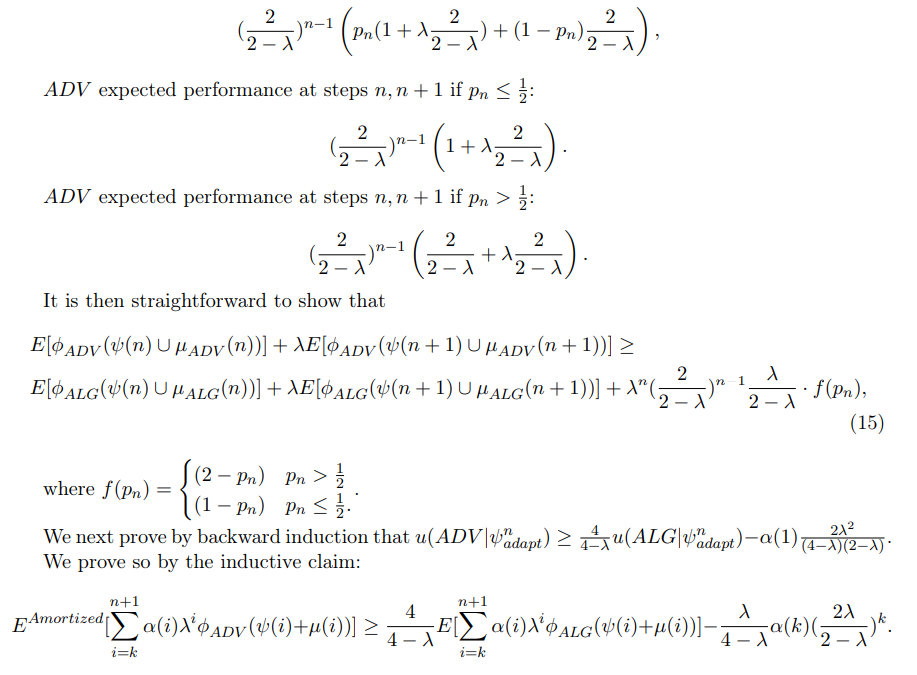
\ As the base case, consider k = n. Then,
\ 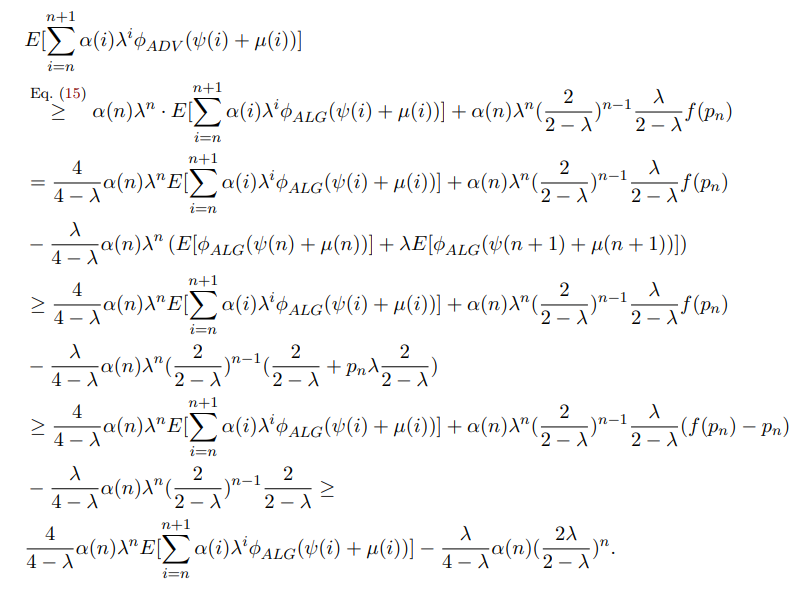
\ For the inductive step,
\ 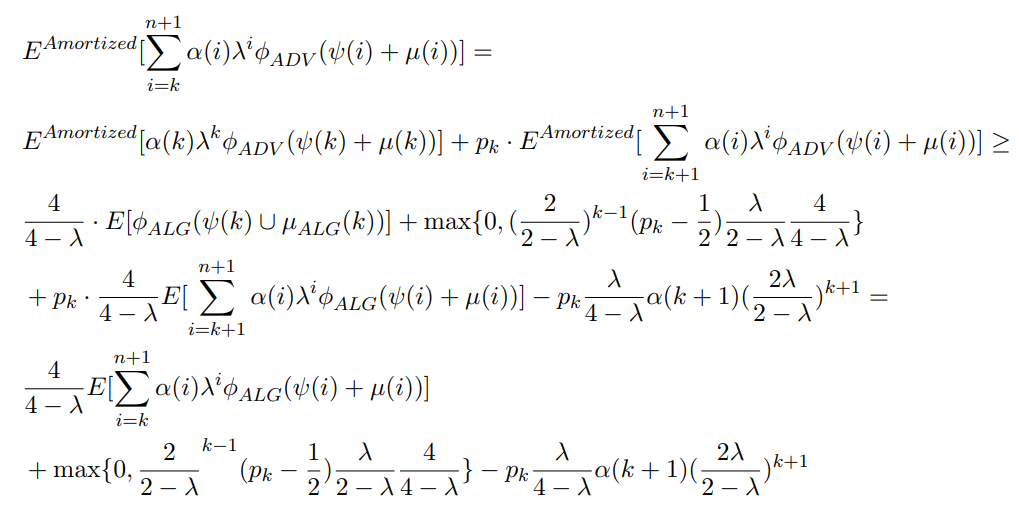
\ We thus need to show that
\ 
\ 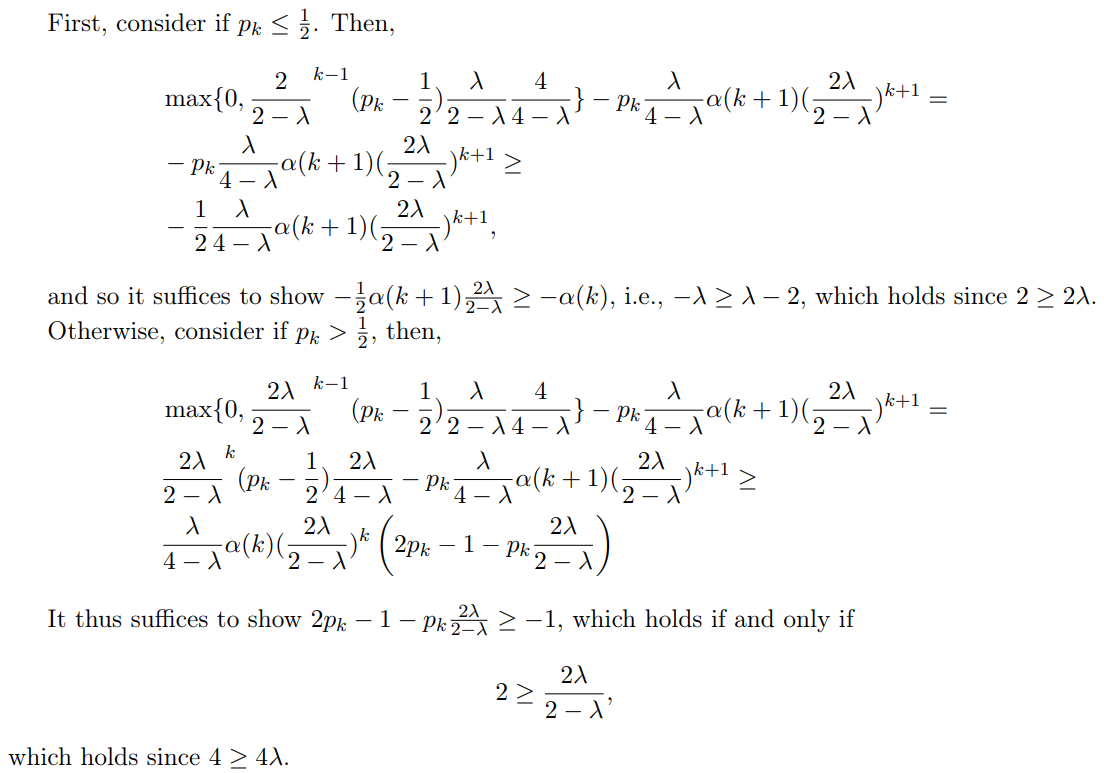
\ 
\ 
\ 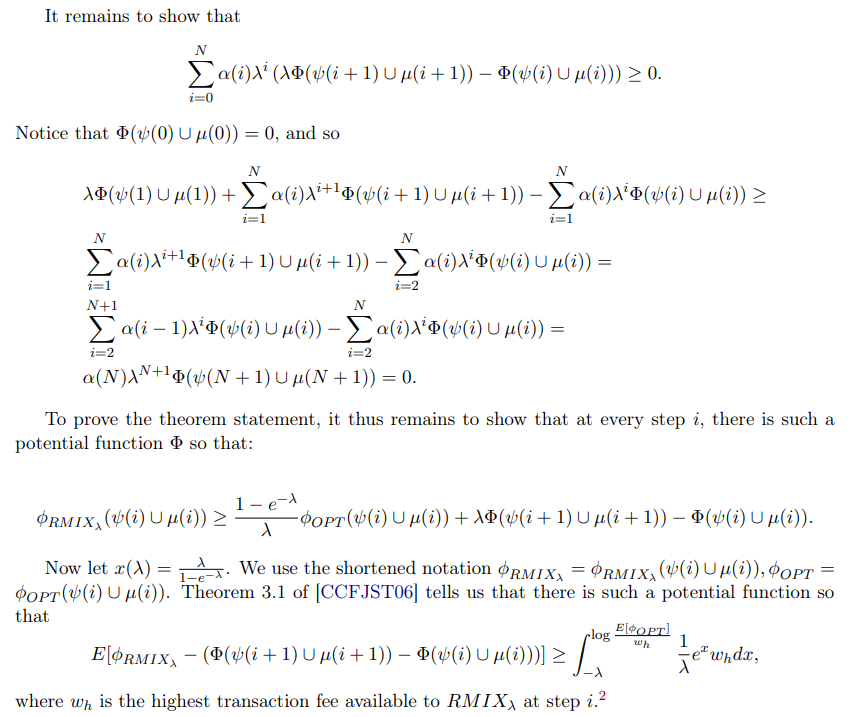
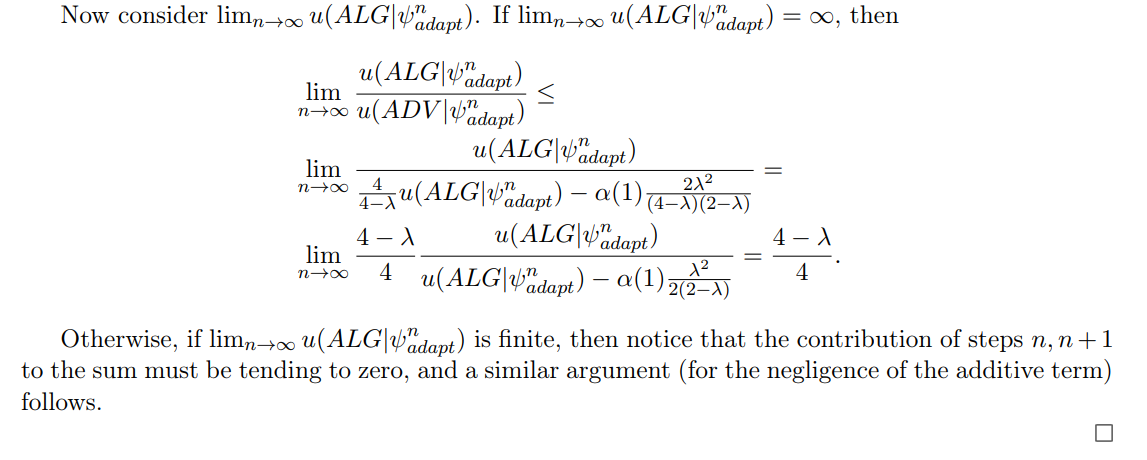
\ With this potential function, we can thus write at step i,
\ 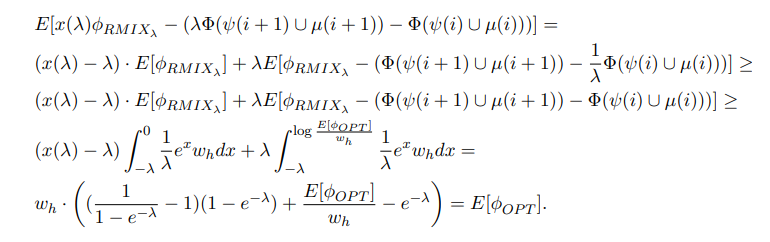
\
C Glossary
A summary of all symbols and acronyms used in the paper.
C.1 Symbols
ψ Transaction schedule function.
\ x Allocation function.
\ B Predefined maximal block-size, in bytes.
\ λ Miner discount factor.
\ ϕ Transaction fee of some transaction, in tokens.
\ T Miner planning horizon.
\ ℓ Immediacy ratio for our non-myopic allocation rule.
\ µ TTL of past transactions.
\ α Miner’s relative mining power, as a fraction. u Miner revenue.
\ t TTL of a transaction.
\ tx A transaction.
C.2 Acronyms
mempool memory pool
\ PoS Proof-of-Stake
\ PoW Proof-of-Work
\ QoS quality of service
\ TFM transaction fee mechanism
\ TTL time to live
\ \
:::info Authors:
(1) Yotam Gafni, Weizmann Institute (yotam.gafni@gmail.com);
(2) Aviv Yaish, The Hebrew University, Jerusalem (aviv.yaish@mail.huji.ac.il).
:::
:::info This paper is available on arxiv under CC BY 4.0 DEED license.
:::
[2] The argument of [CCFJST06] is done by showing conditions that hold for any fixed x ∈ [−1, 0], and so they hold for any fixed x ∈ [−λ, 0] as well.


You May Also Like

Federal Reserve expected to slash rates today, here's how it may impact crypto
Market participants are eagerly anticipating at least a 25 basis point (BPS) interest rate cut from the Federal Reserve on Wednesday. The Federal Reserve, the central bank of the United States, is expected to begin slashing interest rates on Wednesday, with analysts expecting a 25 basis point (BPS) cut and a boost to risk asset prices in the long term.Crypto prices are strongly correlated with liquidity cycles, Coin Bureau founder and market analyst Nic Puckrin said. However, while lower interest rates tend to raise asset prices long-term, Puckrin warned of a short-term price correction. “The main risk is that the move is already priced in, Puckrin said, adding, “hope is high and there’s a big chance of a ‘sell the news’ pullback. When that happens, speculative corners, memecoins in particular, are most vulnerable.”Read more

Pi Network KYC Debate Sparks Questions Over Referral Rewards and Transparency