Dogecoin price has plunged into a technical bear market after falling by over 37% from its highest point in September. Dogecoin (DOGE) token dropped to $0.1900, its lowest point since Oct. 12, giving it a market capitalization of over $28…Dogecoin price has plunged into a technical bear market after falling by over 37% from its highest point in September. Dogecoin (DOGE) token dropped to $0.1900, its lowest point since Oct. 12, giving it a market capitalization of over $28…

Red alert: Dogecoin price risky pattern nears as DOGE ETF growth stalls

Dogecoin price has plunged into a technical bear market after falling by over 37% from its highest point in September.

Summary
  • Dogecoin price is about to form a death cross pattern. 
  • Inflows into the DOGE ETF have stalled as investors remain in the sidelines.
  • The futures open interest and the funding rate has moved downside.

Dogecoin (DOGE) token dropped to $0.1900, its lowest point since Oct. 12, giving it a market capitalization of over $28 billion. It remains 60% below the highest level this year.

DOGE price has plunged as investors come to terms with the recent crash that led to $365 million worth of liquidations. As a result, investors have remained on the sidelines.

For example, the recently-launched REX-Osprey DOGE ETF (DOJE) inflows have slowed in the past few days. It now holds about $31 million in assets, where it has remained this week. This amount is still a sign of strong demand for an ETF with a 1.5% expense ratio. 

Dogecoin price has also come under pressure as its funding rate drops. It has remained in the negative zone for the past two days, a sign that investors anticipate that the price will remain in the red for a while.

DOGE price has also moved lower as the futures open interest has plunged, moving from a high of $6 billion in September to $1.92 billion. Falling open interest is a sign that investors are staying on the sidelines as the crypto market remains on edge. 

The most likely catalyst for the Dogecoin price is that the government shutdown could end soon and lead to more DOGE ETF approvals.

Dogecoin price technical analysis

Dogecoin price

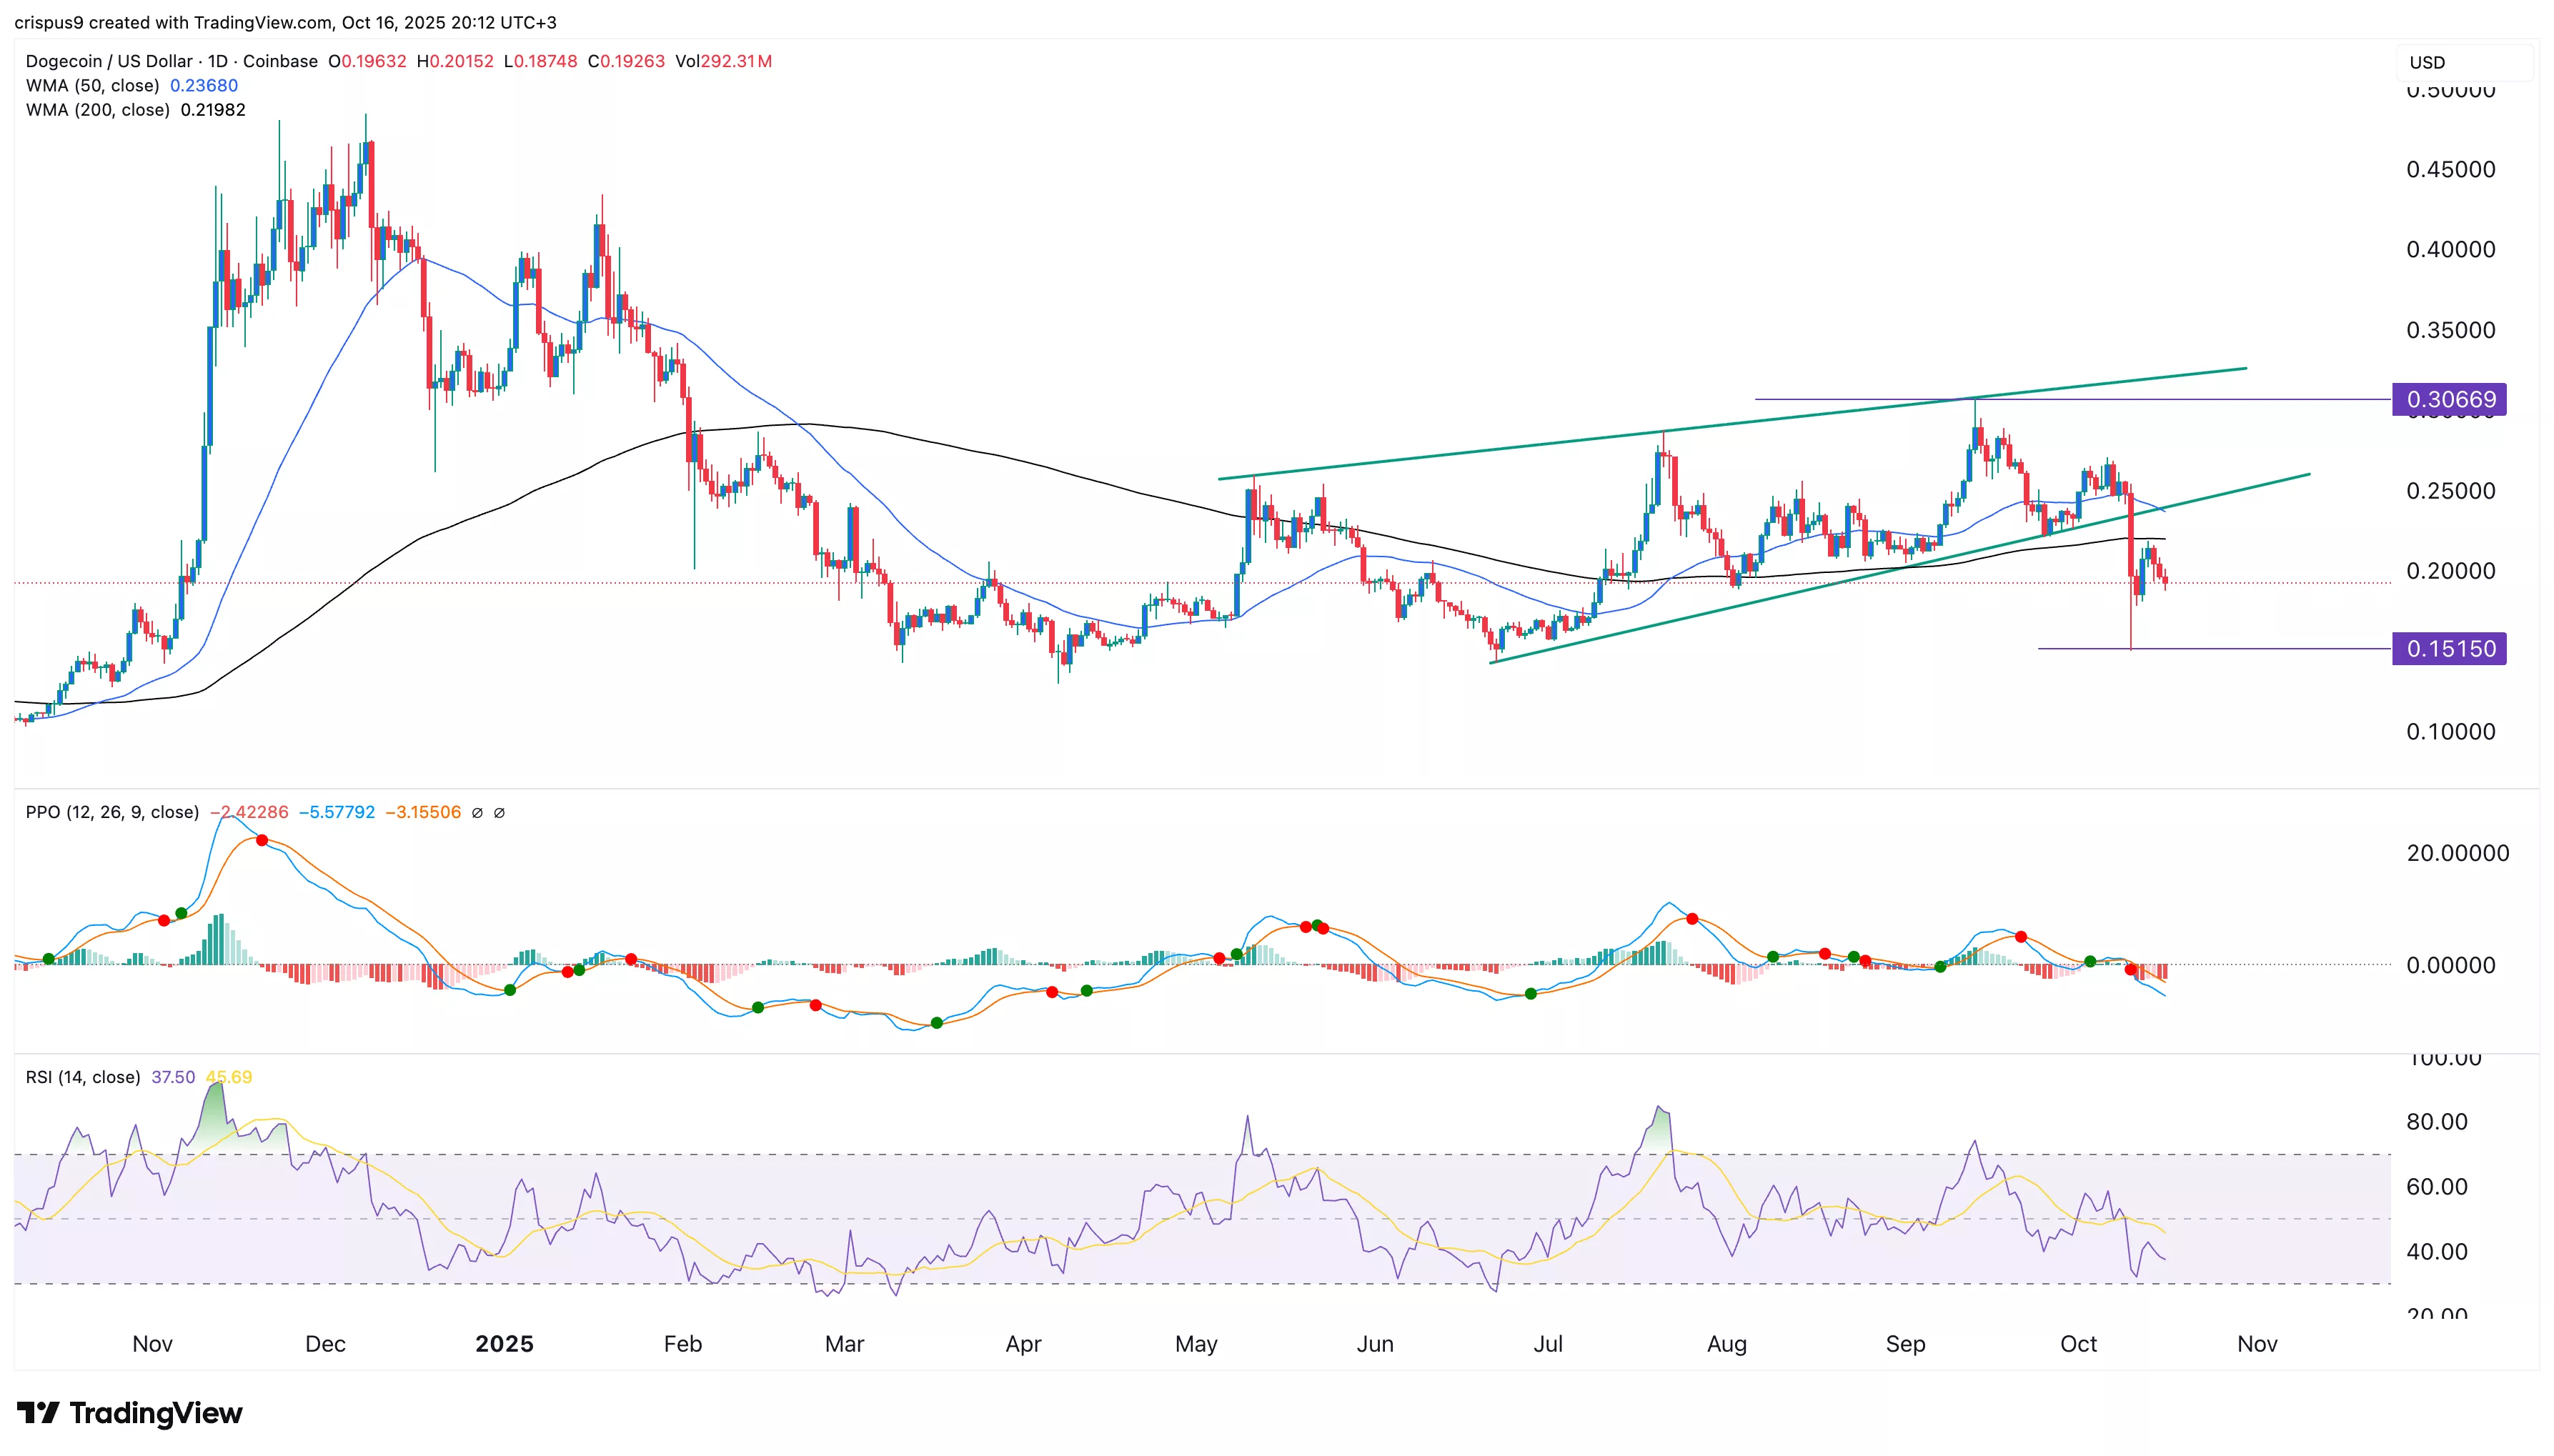
The daily time frame chart shows that the DOGE price has crashed in the past few days. This crash happened as it formed a highly bearish rising wedge pattern. A wedge is made up of two ascending and converging trendlines.

Dogecoin price has moved below the 50-day and 200-day exponential moving averages. The spread between the two averages is narrowing, meaning that a death cross may happen soon.

The Relative Strength Index has moved below the neutral point at 50 and is nearing the oversold level. Also, the Percentage Price Oscillator has moved below the zero line.

Therefore, the token will likely continue falling as sellers target the year-to-date low of $0.1515. A move below that level will point to more downside in the near term.

Market Opportunity
RedStone Logo
RedStone Price(RED)
$0.2225
$0.2225$0.2225
-0.66%
USD
RedStone (RED) Live Price Chart
Disclaimer: The articles reposted on this site are sourced from public platforms and are provided for informational purposes only. They do not necessarily reflect the views of MEXC. All rights remain with the original authors. If you believe any content infringes on third-party rights, please contact service@support.mexc.com for removal. MEXC makes no guarantees regarding the accuracy, completeness, or timeliness of the content and is not responsible for any actions taken based on the information provided. The content does not constitute financial, legal, or other professional advice, nor should it be considered a recommendation or endorsement by MEXC.

You May Also Like

The Surprising 2025 Decline In Online Interest Despite Market Turmoil

The Surprising 2025 Decline In Online Interest Despite Market Turmoil

The post The Surprising 2025 Decline In Online Interest Despite Market Turmoil appeared on BitcoinEthereumNews.com. Bitcoin Searches Plunge: The Surprising 2025
Share
BitcoinEthereumNews2026/01/21 14:56
Cryptos Signal Divergence Ahead of Fed Rate Decision

Cryptos Signal Divergence Ahead of Fed Rate Decision

The post Cryptos Signal Divergence Ahead of Fed Rate Decision appeared on BitcoinEthereumNews.com. Crypto assets send conflicting signals ahead of the Federal Reserve’s September rate decision. On-chain data reveals a clear decrease in Bitcoin and Ethereum flowing into centralized exchanges, but a sharp increase in altcoin inflows. The findings come from a Tuesday report by CryptoQuant, an on-chain data platform. The firm’s data shows a stark divergence in coin volume, which has been observed in movements onto centralized exchanges over the past few weeks. Bitcoin and Ethereum Inflows Drop to Multi-Month Lows Sponsored Sponsored Bitcoin has seen a dramatic drop in exchange inflows, with the 7-day moving average plummeting to 25,000 BTC, its lowest level in over a year. The average deposit per transaction has fallen to 0.57 BTC as of September. This suggests that smaller retail investors, rather than large-scale whales, are responsible for the recent cash-outs. Ethereum is showing a similar trend, with its daily exchange inflows decreasing to a two-month low. CryptoQuant reported that the 7-day moving average for ETH deposits on exchanges is around 783,000 ETH, the lowest in two months. Other Altcoins See Renewed Selling Pressure In contrast, other altcoin deposit activity on exchanges has surged. The number of altcoin deposit transactions on centralized exchanges was quite steady in May and June of this year, maintaining a 7-day moving average of about 20,000 to 30,000. Recently, however, that figure has jumped to 55,000 transactions. Altcoins: Exchange Inflow Transaction Count. Source: CryptoQuant CryptoQuant projects that altcoins, given their increased inflow activity, could face relatively higher selling pressure compared to BTC and ETH. Meanwhile, the balance of stablecoins on exchanges—a key indicator of potential buying pressure—has increased significantly. The report notes that the exchange USDT balance, around $273 million in April, grew to $379 million by August 31, marking a new yearly high. CryptoQuant interprets this surge as a reflection of…
Share
BitcoinEthereumNews2025/09/18 01:01
Strategy Makes Biggest Bitcoin Bet In Months With $2.13B Buy

Strategy Makes Biggest Bitcoin Bet In Months With $2.13B Buy

The post Strategy Makes Biggest Bitcoin Bet In Months With $2.13B Buy appeared on BitcoinEthereumNews.com. Strategy Makes Biggest Bitcoin Bet In Months
Share
BitcoinEthereumNews2026/01/21 15:07