

Halving Cycle? Exchange Inflows? Forget Them — The Post-ETF Era Playbook
Bitcoin’s “four-year law” may be breaking for the first time. Despite record inflows into spot ETFs and swelling corporate treasuries, the market is no longer moving in lockstep with the halving cycle.
Instead, liquidity shocks, sovereign wealth allocations, and derivatives growth are emerging as the new anchors of price discovery. This shift raises a critical question for 2026: can institutions still rely on cycle playbooks, or must they rewrite the rules entirely?
Has the cycle finally snapped?
With these forces now setting the pace, the question is not whether the old cycle still matters but whether it has already been replaced. BeInCrypto spoke with James Check, Co-Founder and on-chain analyst at Checkonchain Analytics and former Lead On-Chain Analyst at Glassnode, to test this thesis.
For years, Bitcoin investors treated the four-year halving cycle as gospel. That rhythm now faces its toughest test. In September 2025, CoinShares tracked $1.9 billion in ETF inflows—nearly half of it into Bitcoin—while Glassnode flagged $108,000–$114,000 as a make-or-break zone. At the same time, CryptoQuant recorded exchange inflows collapsing to historic lows, even as Bitcoin pushed into fresh all-time highs.
ETF inflows: fresh demand or reshuffling?
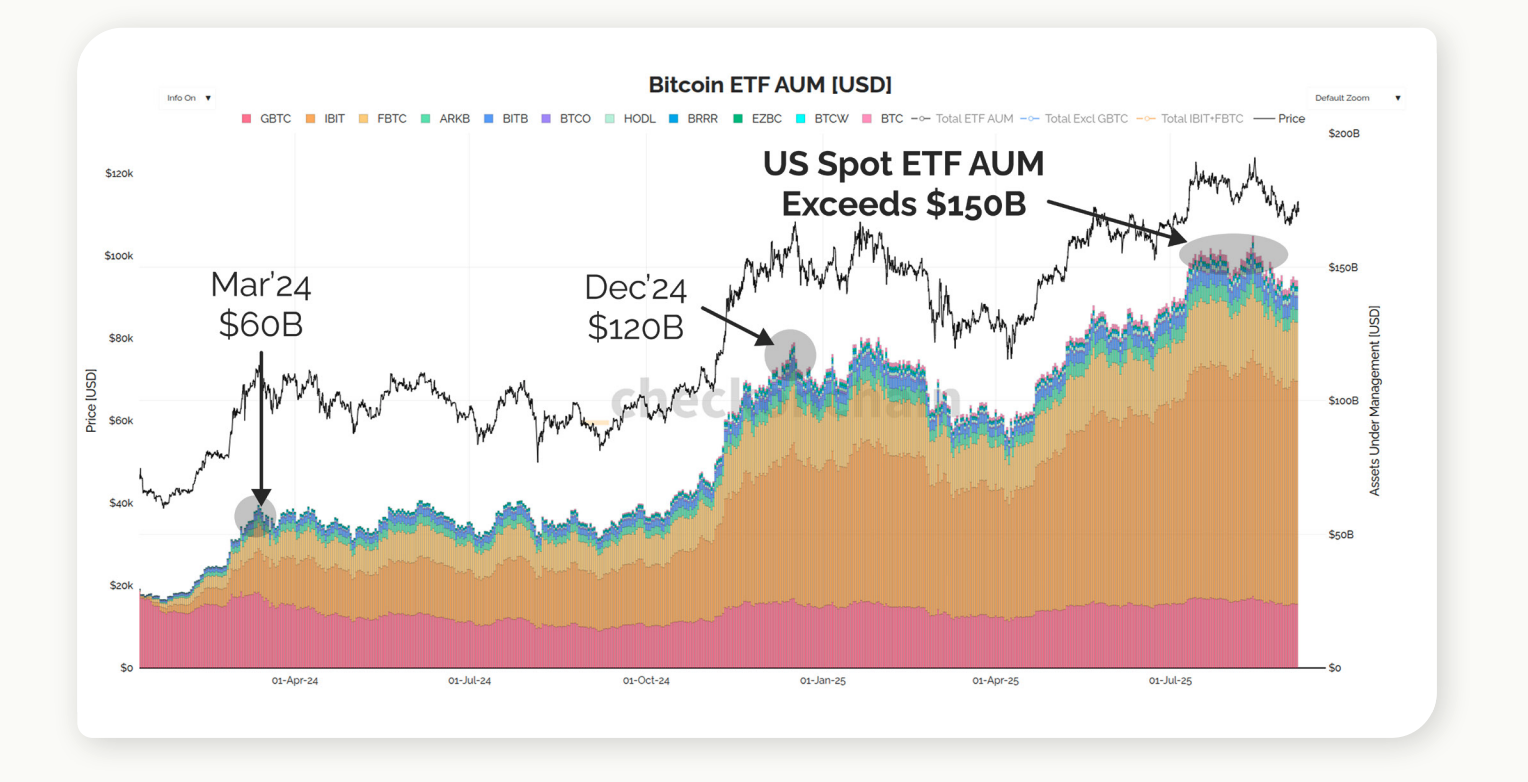
September’s ETF inflows highlighted robust demand, but investors need to know whether this is genuinely new capital or simply existing holders rotating from vehicles like GBTC. That distinction affects how much structural support the rally has.
 Source: Checkonchain
James noted that ETFs have already absorbed around $60 billion in total inflows. Market data shows this figure is overshadowed by monthly realized profit-taking of $30–100 billion from long-term holders, underscoring why prices have not climbed as quickly as ETF demand alone might suggest.
Exchange flows: signal or noise?
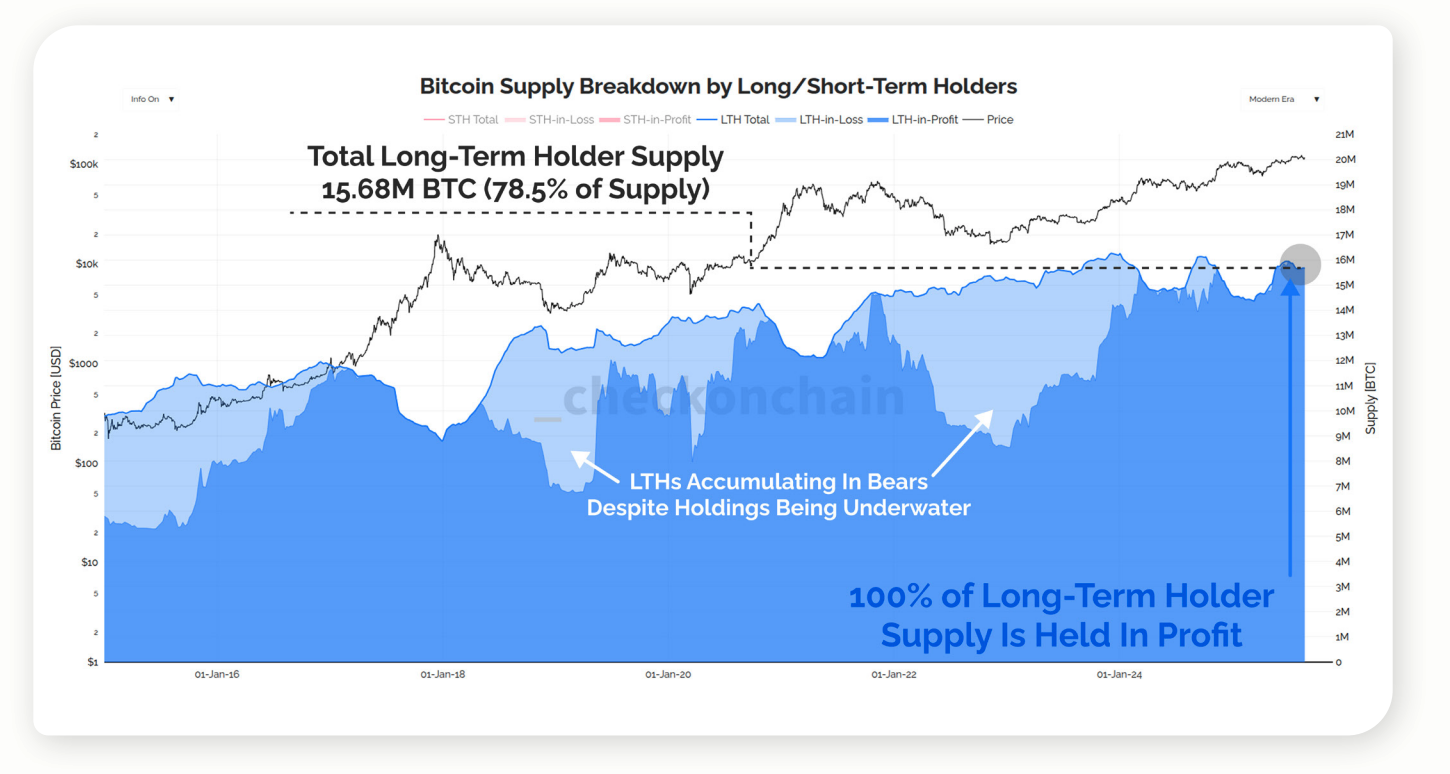
CryptoQuant shows that exchange inflows reached record lows at Bitcoin’s 2025 highs. At face value, this could mean structural scarcity. However, James cautioned against over-reliance on these metrics.
 Source: Checkonchain
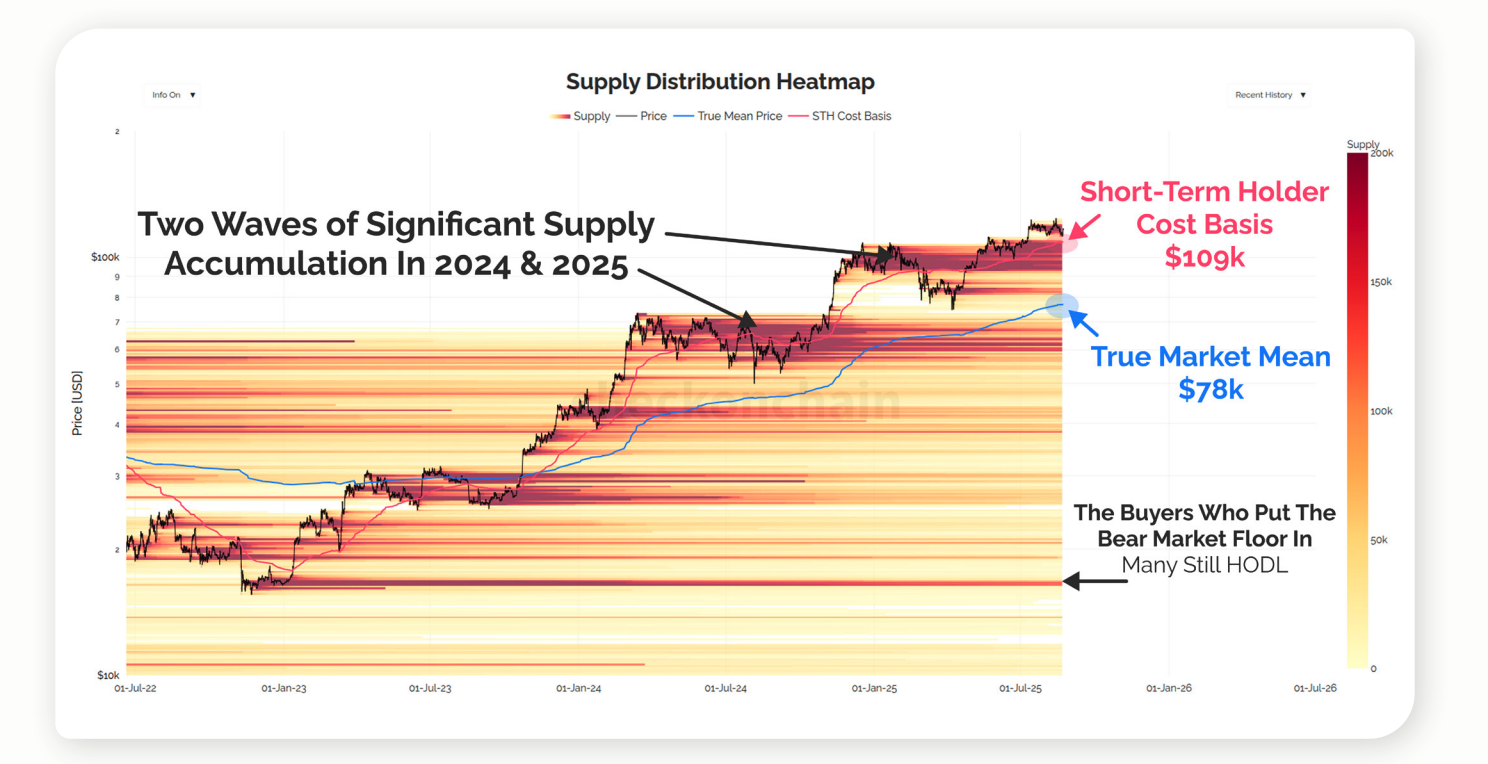
Analysis confirms this limitation, noting that long-term holder supply—currently 15.68 million BTC, or about 78.5% of circulating supply, and all in profit—is a more reliable gauge of scarcity than exchange balances.
Do miners still move the market?
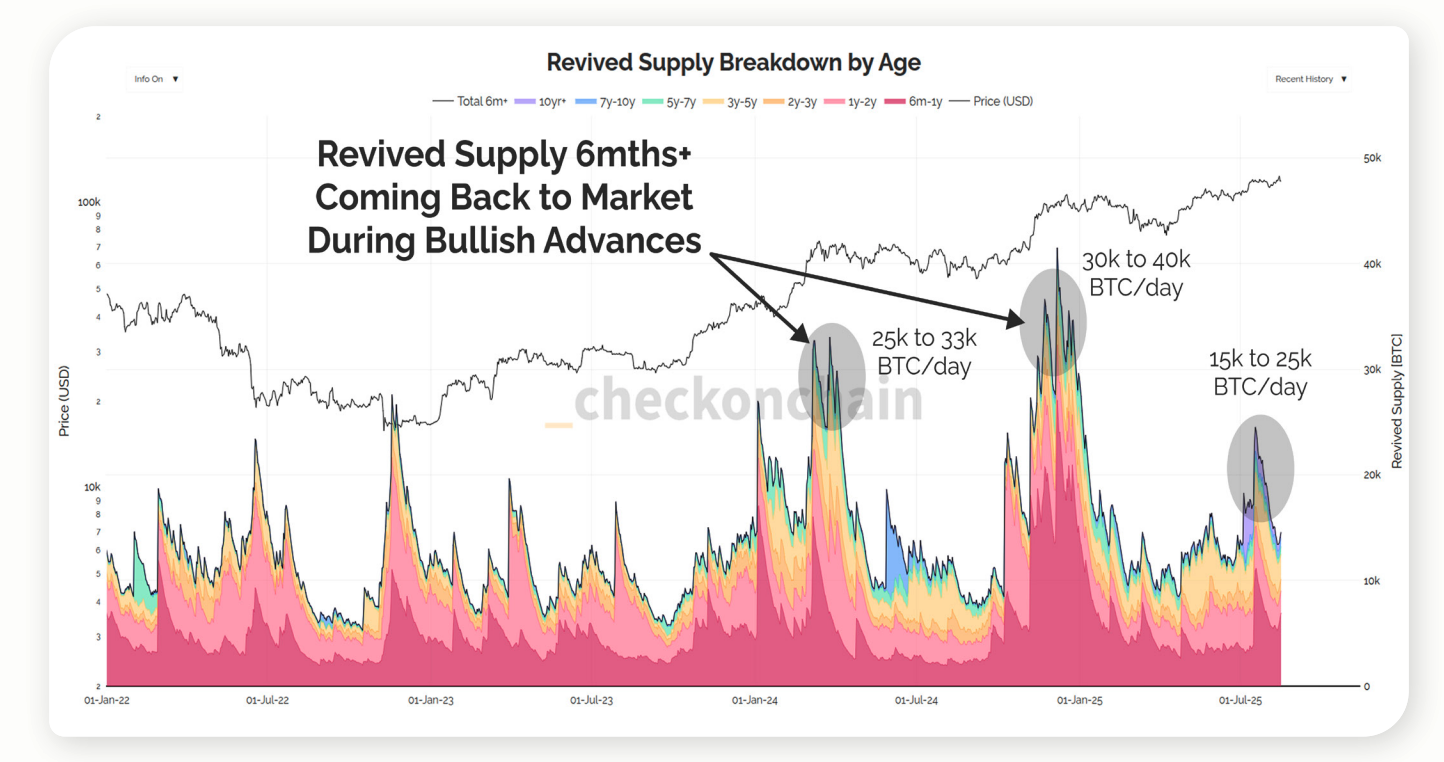
For years, mining was shorthand for downside risk. Yet with ETF and treasury flows now dominating, their influence may be far more negligible than many assume.
 Source: Checkonchain
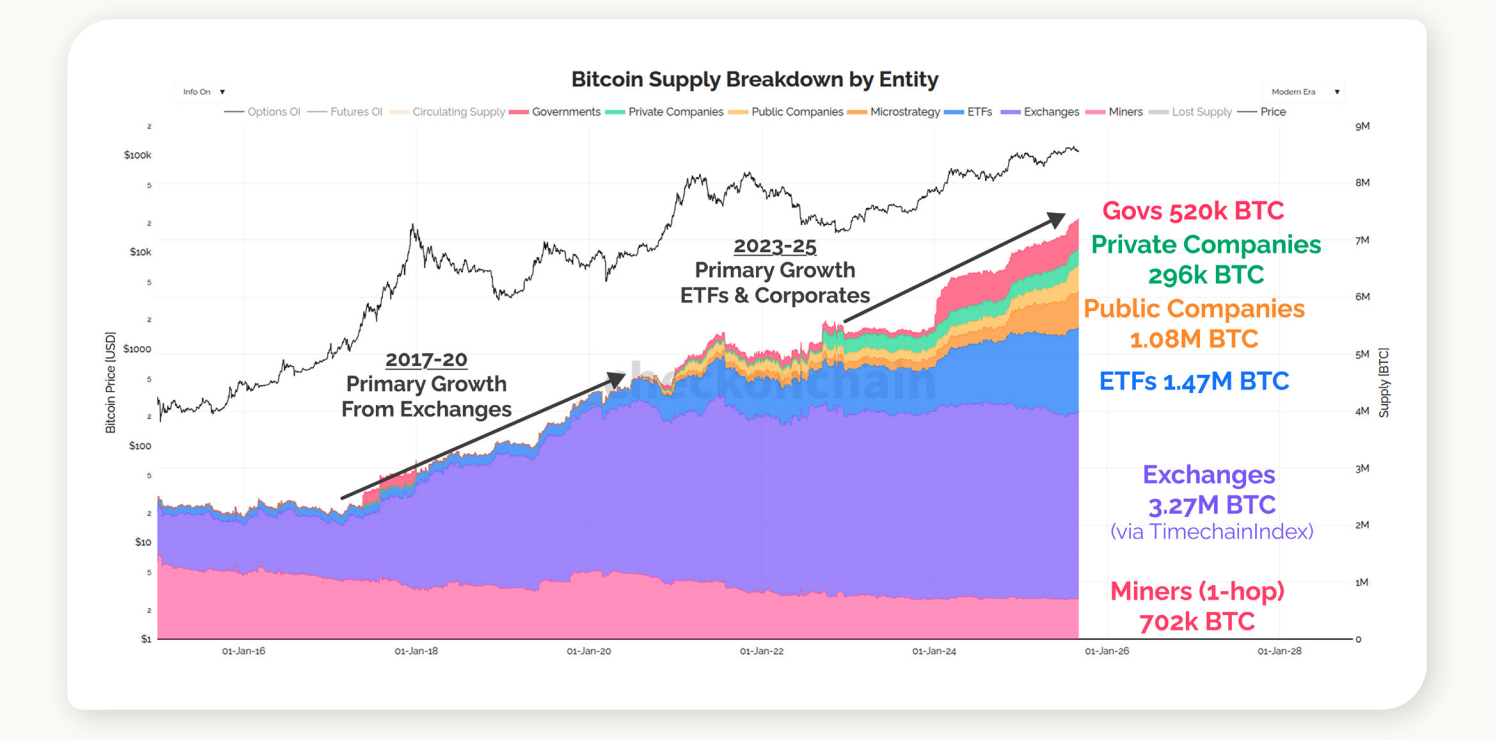
The roughly 450 BTC issued daily by miners is negligible compared with the revived supply from long-term holders, which can reach 10,000–40,000 BTC per day in peak rallies. This imbalance illustrates why miner flows no longer define market structure.
From cycles to liquidity regimes
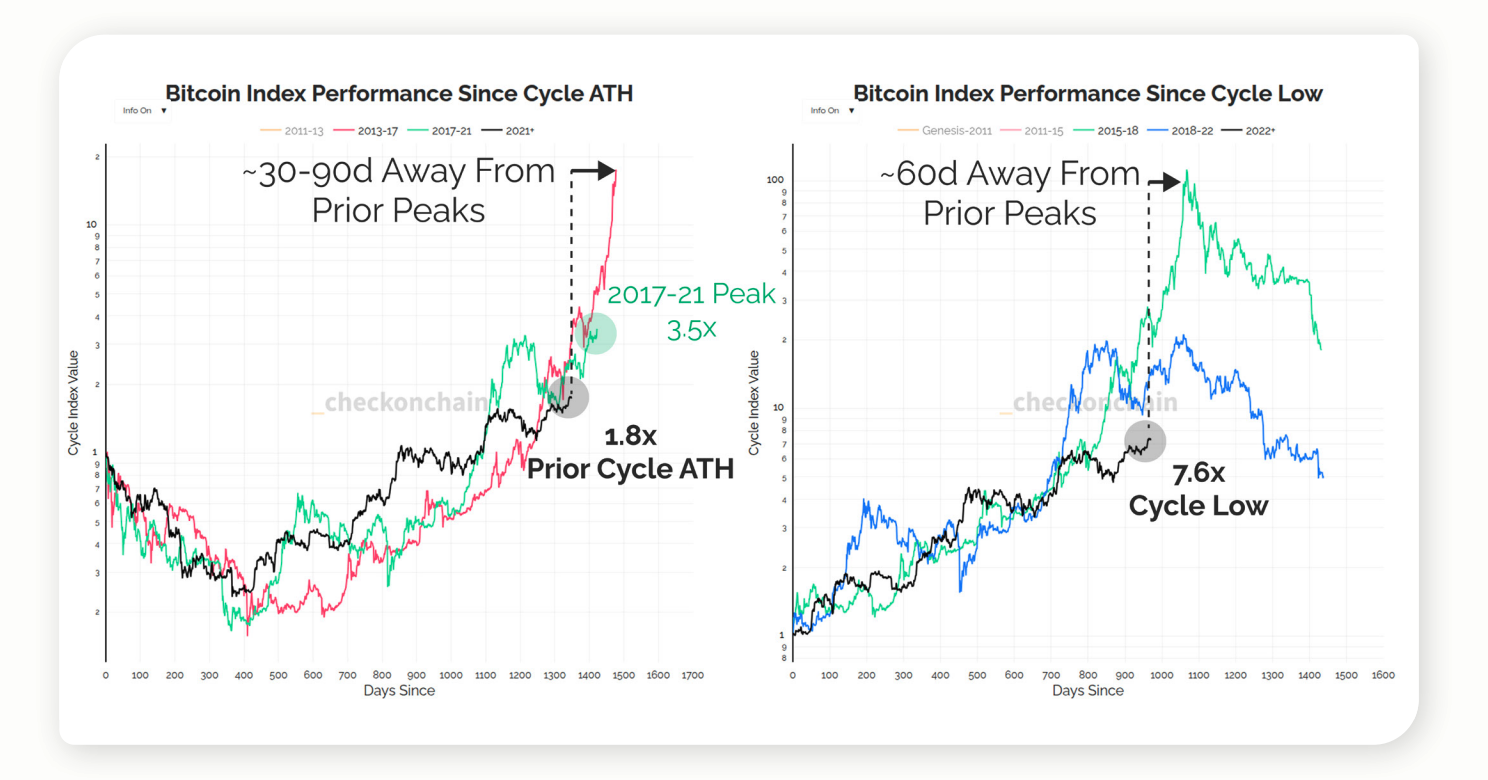
Asked whether Bitcoin still respects its four-year cycle or has shifted into a liquidity-driven regime, James pointed to structural pivots in adoption.
 Source: Checkonchain
Analysis supports this view, noting that volatility compression and the rise of ETFs and derivatives have shifted Bitcoin into a more index-like role in global markets. It also stressed that liquidity conditions, not halving cycles, now set the pace.
Realized Price and new bear-market floors
Traditionally, the realized price acted as a reliable cycle diagnostic. Fidelity’s models suggest post-halving corrections occur 12–18 months after the event. James, however, argued that the metric is now outdated—and that investors should watch where the marginal cost bases cluster instead.
 Source: Checkonchain
Their data show a clustering of cost bases around $74,000–$80,000—covering ETFs, corporate treasuries, and actual market averages—indicating that this range now anchors potential bear-market floors.
MVRV and the limits of metrics
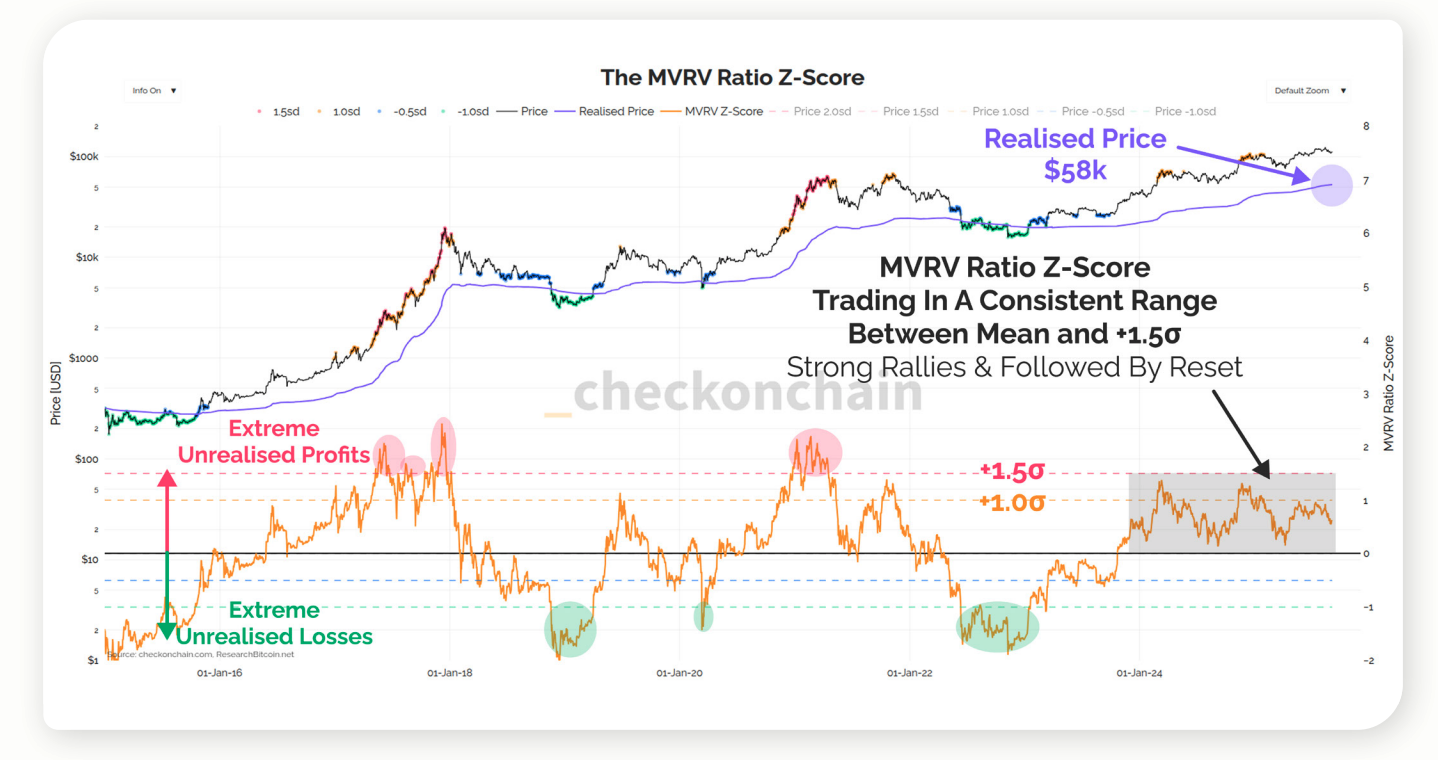
By contrast, MVRV Z-Score has not broken, but its thresholds have drifted with market depth and instrument mix. James advised flexibility.
 Source: Checkonchain
Their data shows MVRV cooling near +1σ and then plateauing, rather than reaching historical extremes—reinforcing James’s view that context beats fixed cut-offs.
Sovereign flows and custody risk
As sovereign wealth funds and pensions consider exposure, concentration risk has become a key concern. James acknowledged that Coinbase holds most of the Bitcoin, but argued that proof-of-work offsets systemic risk.
 Source: Checkonchain
Data confirms that Coinbase serves as custodian for most US spot ETFs, illustrating the degree of concentration and why James frames it as a market rather than a security risk.
Options, ETFs, and U.S. dominance
James pointed to derivatives as the decisive factor in Vanguard’s potential entry into ETF and tokenized markets.
 Source: Checkonchain
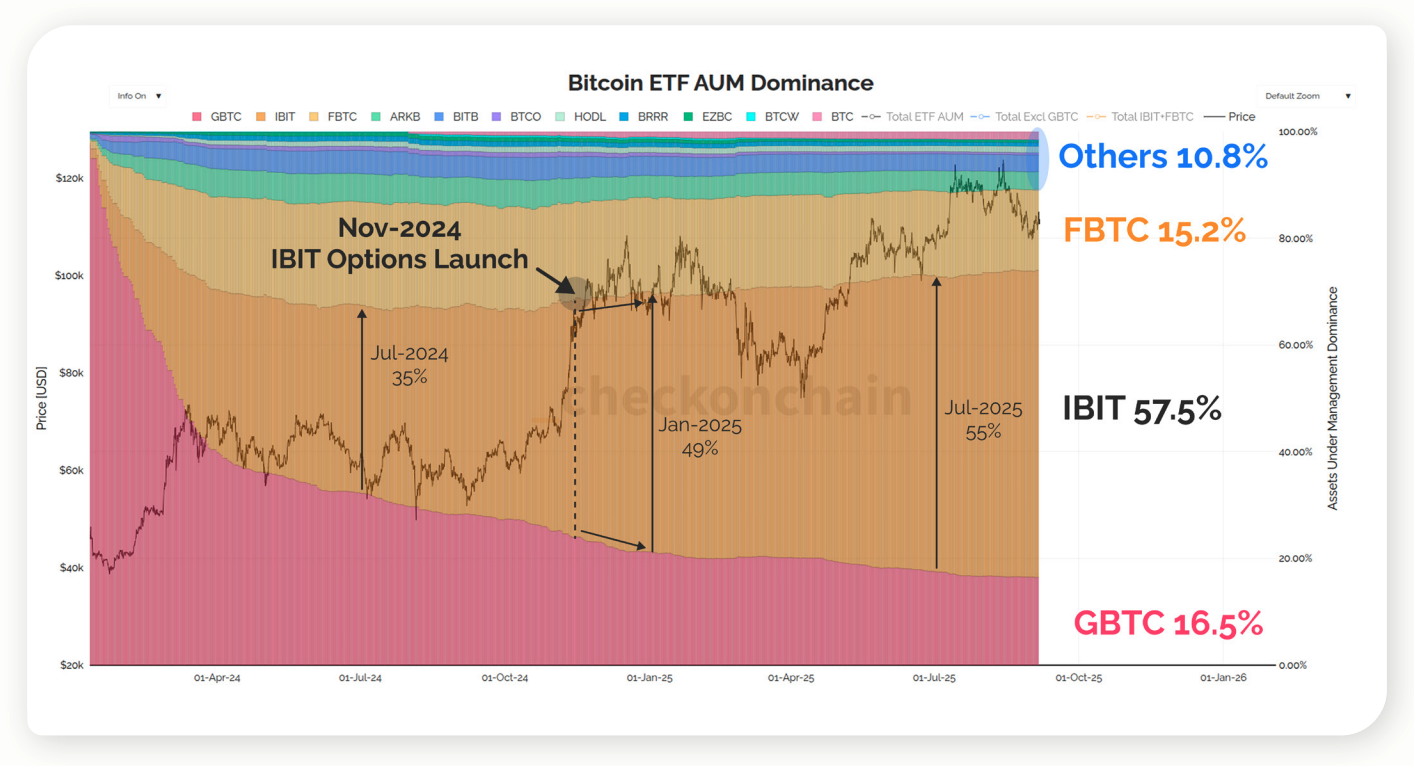
Market analysis shows BlackRock’s IBIT capturing most of AUM share after launching options in late 2024, with US ETFs commanding nearly 90% of global flows—underscoring derivatives as the actual driver of market dynamics. IBIT dominance aligns with reports of US ETFs shaping almost all new inflows, reinforcing the country’s outsized role.
Closing thoughts
James argued that preparing strategies for downside and upside scenarios is the most practical way to navigate volatility through 2026 and beyond.
His analysis suggests that Bitcoin’s four-year halving cycle may no longer define its trajectory. ETF inflows and sovereign-scale capital have introduced new structural drivers, while long-term holder behavior remains the key constraint.
Metrics like Realized Price and MVRV require reinterpretation, with $75,000–$80,000 emerging as the likely floor in a modern bear market. For institutions, the focus in 2026 should shift toward liquidity regimes, custody dynamics, and the derivatives markets now forming on top of ETFs.


You May Also Like

Iran agrees to hand over enriched uranium stockpile ahead of Islamabad talks

Flutterwave partner Kulipa secures $6.2 million to bring Stablecoin-funded payment cards to Nigeria


