Ethereum Death Cross That Last Preceded A 60% Drop Just Returned
On-chain data shows the Ethereum MVRV Ratio has just given a signal that last took the cryptocurrency’s price from $3,300 to $1,400.
Ethereum MVRV Ratio Has Formed A Death Cross
In a new post on X, analyst Ali Martinez has talked about a signal that has appeared for Ethereum in the Market Value to Realized Value (MVRV) Ratio. This on-chain indicator measures the ratio between the ETH Market Cap and Realized Cap.
The Realized Cap here is a capitalization model for the cryptocurrency that calculates its total value by assuming the ‘real’ value of each token in circulation is equal to the price at which it was last transacted on the blockchain.
Since the last transaction of any token is likely to represent the last time it changed hands, the price at its time would denote its current cost basis. As such, the Realized Cap is a measure of the total cost basis of the ETH circulating supply. In other words, the model represents the amount of capital the investors as a whole have put into the asset.
The Market Cap, on the other hand, signifies the value that the investors are carrying in the present. Thus, its comparison with the Realized Cap in the MVRV Ratio tells us about the profit-loss situation of the holders.
When the value of the indicator is greater than 1, it means the investors are holding more value than they put in. On the other hand, it being under the cutoff suggests the overall market is underwater.
Now, here is the chart shared by Martinez that shows the trend in the Ethereum MVRV Ratio and its 160-day moving average (MA) over the past year:
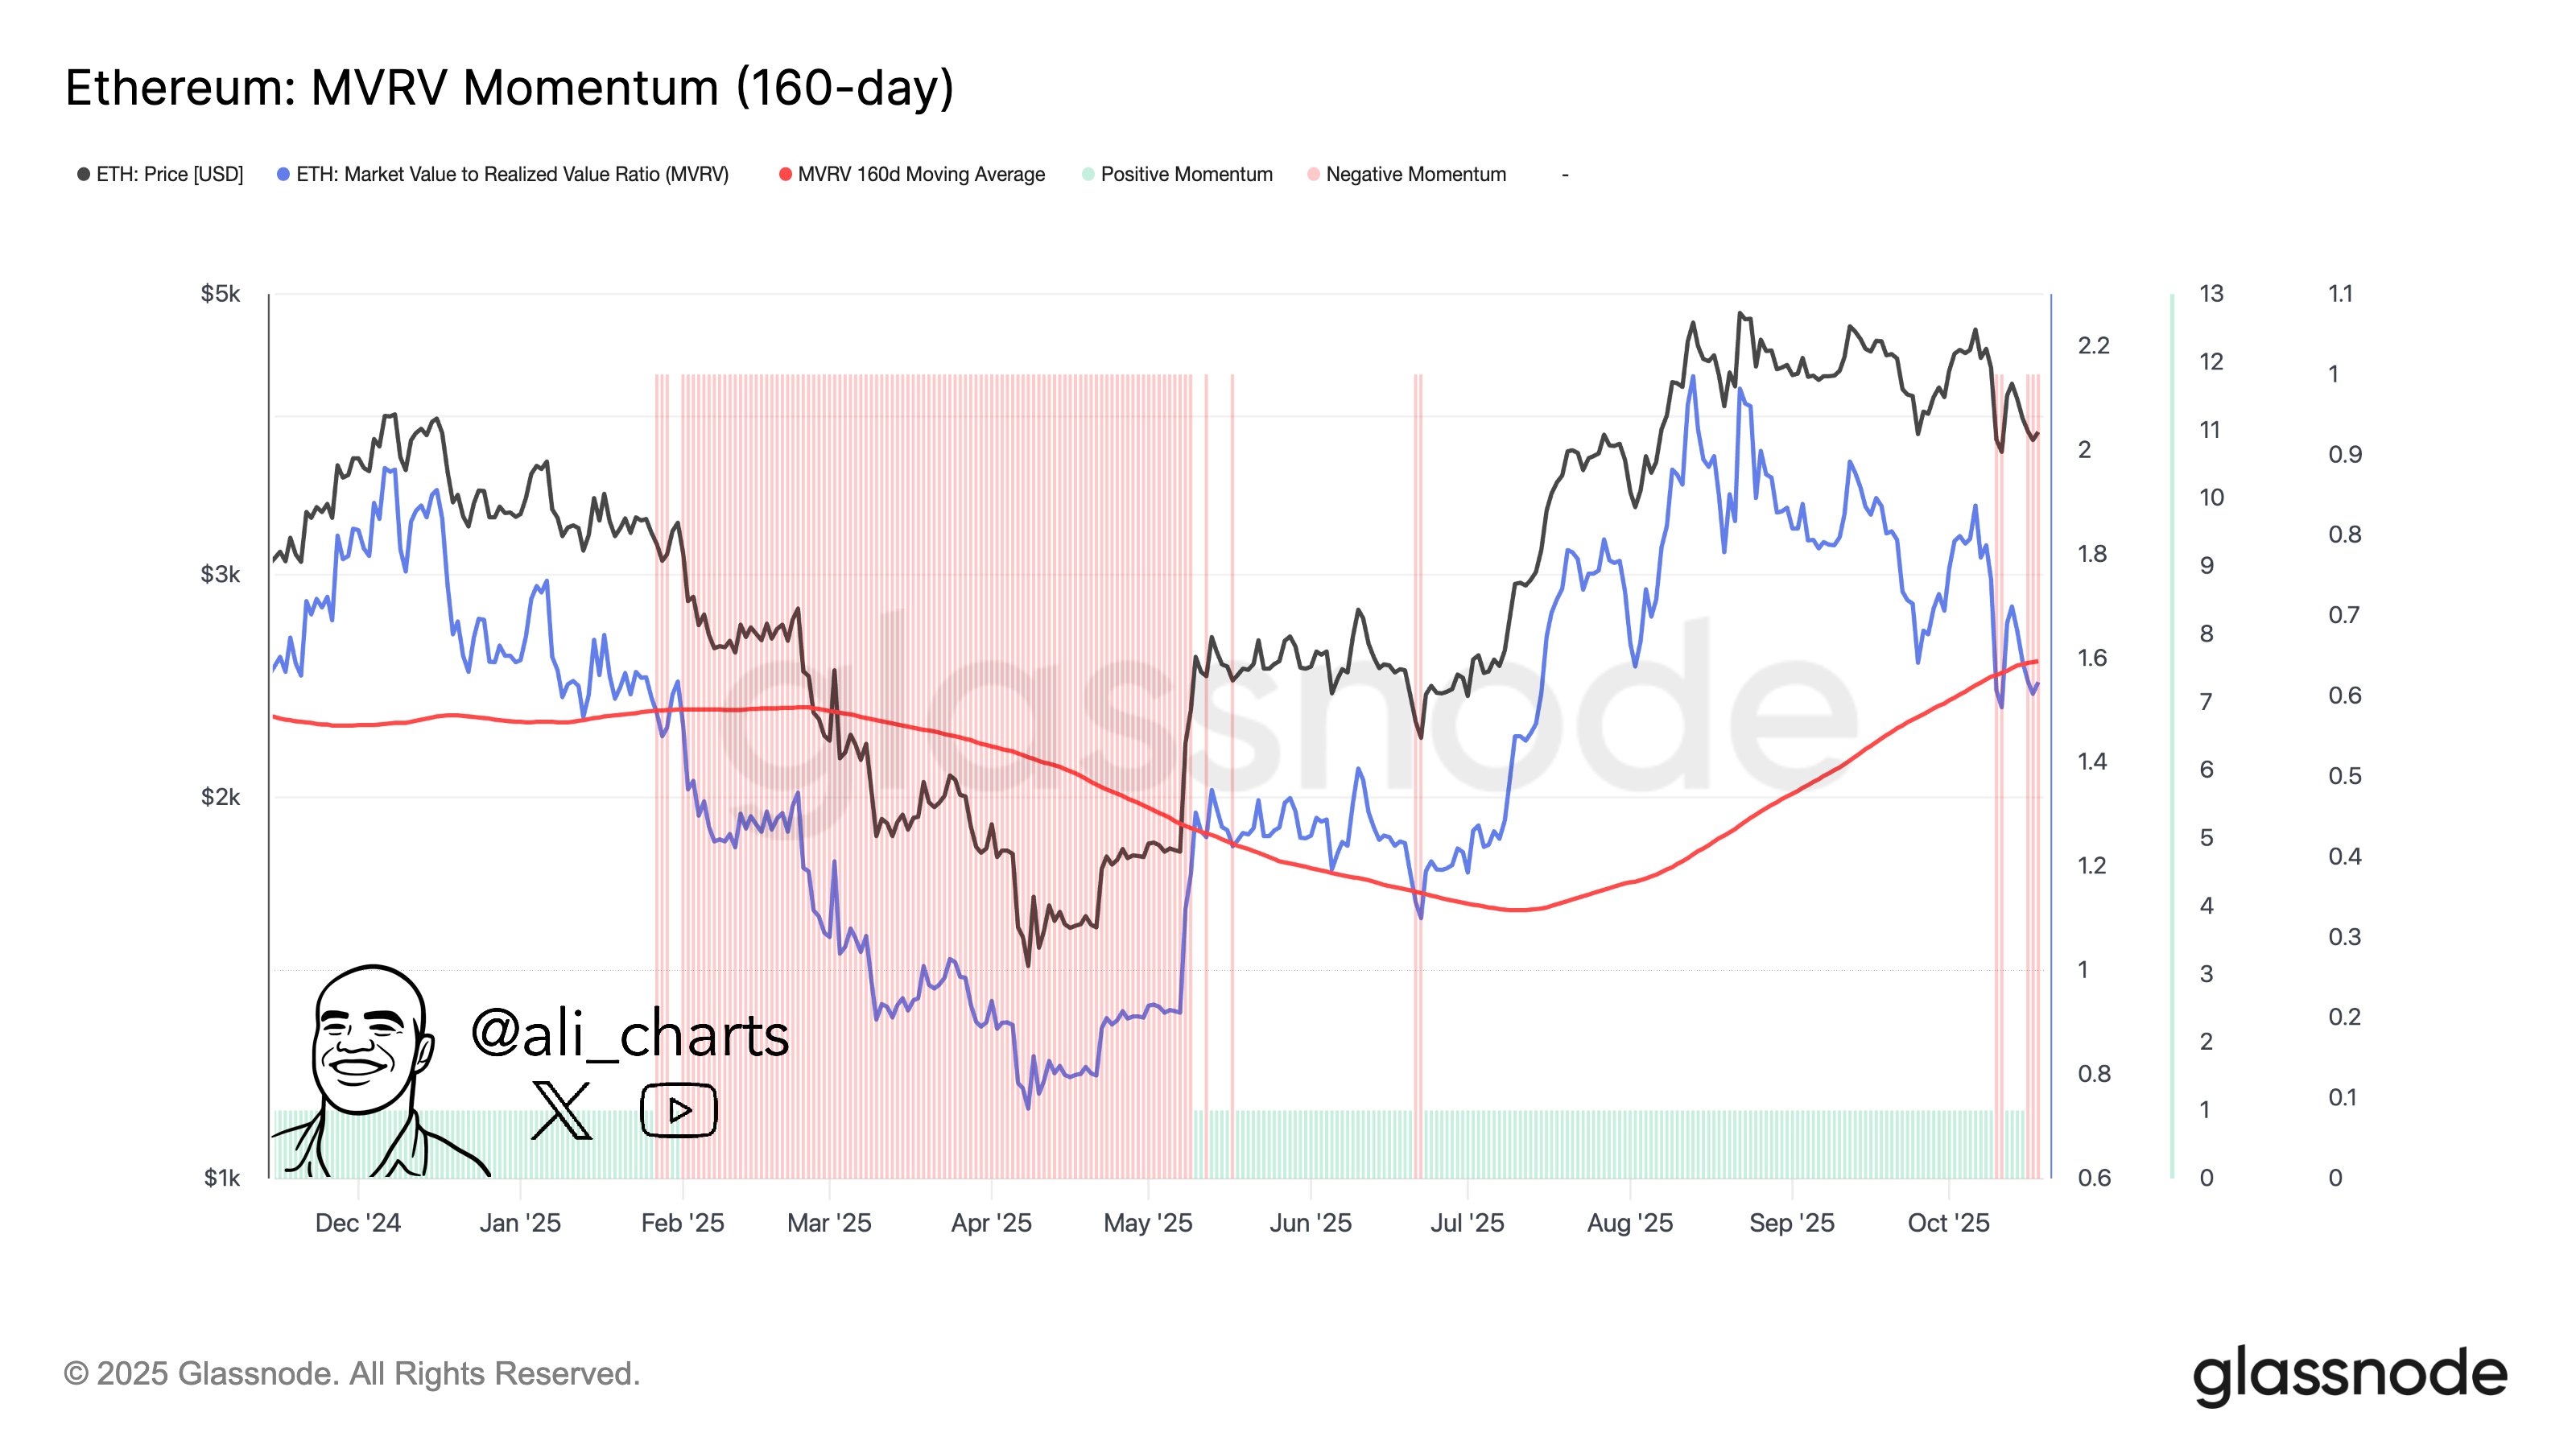
As displayed in the above graph, the Ethereum MVRV Ratio has witnessed a decline recently as ETH’s price has gone down, implying holder profitability has been dropping.
With the latest drawdown, the indicator’s daily value has plunged below the 160-day MA. In the chart, Martinez has highlighted the previous instances of this crossover taking place. It would appear that the MVRV Ratio’s fall under this line in February led into a significant decrease in the ETH price from $3,300 to $1,400, a swing of almost 60%.
Other instances of the crossover, however, didn’t mean much for Ethereum. It should be noted, though, that in these instances, including the one from earlier in the month, the metric was swift to recover back above the line, essentially canceling out the death cross.
It now remains to be seen whether the latest break below the line is going to be a sustainable one like in February, or if it will be another quick dip.
ETH Price
At the time of writing, Ethereum is floating around $4,000, down 2% over the last week.


You May Also Like

Strategy CEO Highlights Scenarios Where Company Would Sell Bitcoin — Report

Scott Jennings accused of 'cheating' as fiery exchange breaks out on CNN: 'Let me finish!'