

Bitcoin Price: Bitwise Research Reveals 4% Gold Rotation Could Double BTC Price
TLDR
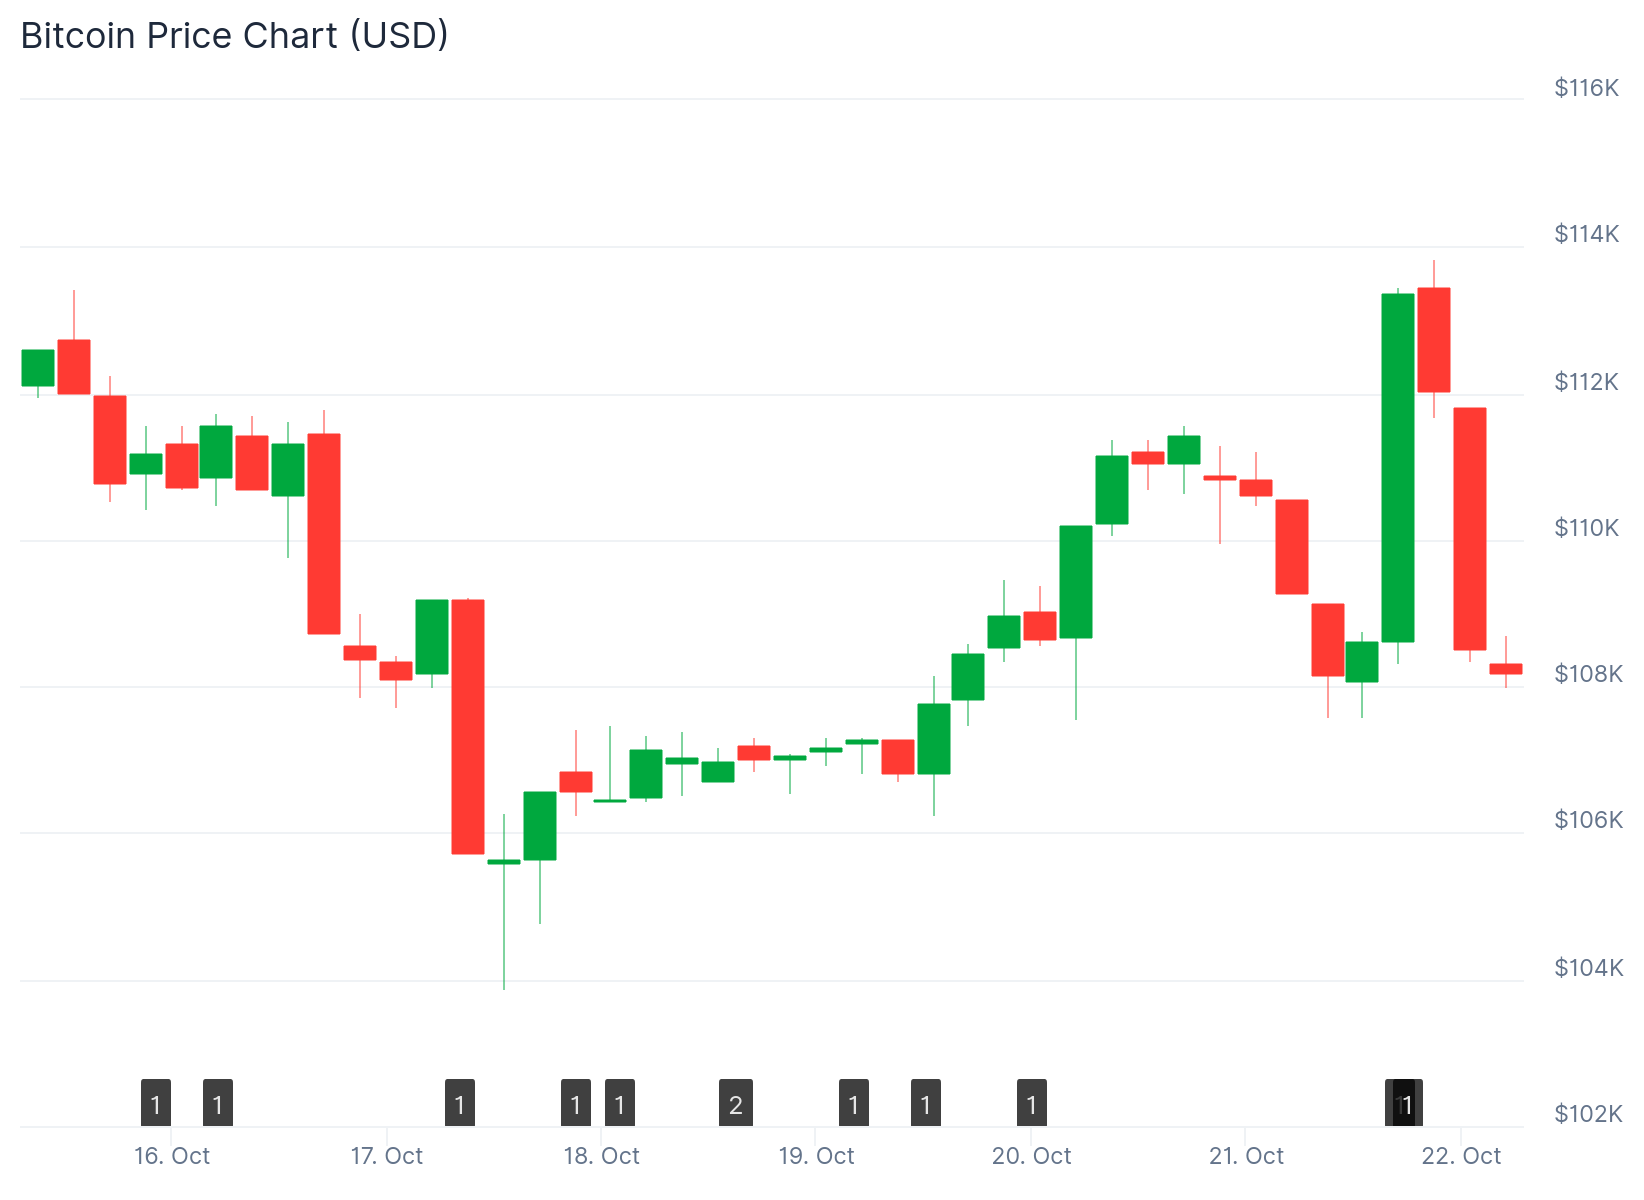
- Bitcoin price returned to $110,000 after bouncing from weekend CME futures gap levels while gold dropped more than 5% in daily losses
- Bitwise research suggests just 3-4% capital rotation from the $13 trillion gold market to Bitcoin could double BTC’s current price
- Trading data shows liquidation patterns with funding rates in negative territory, indicating traders expect further downside
- Gold faces potential double top pattern after recent all-time highs, with analysts forecasting possible retest of $4,000
- Bitcoin’s $1.2 trillion market cap remains small compared to gold, making it vulnerable to large price swings from modest capital inflows
Bitcoin returned to the $110,000 level on Tuesday as Wall Street trading began. The move came after BTC price dropped toward the weekend gap in CME Group’s Bitcoin futures market without filling it completely.
 Bitcoin (BTC) Price
The cryptocurrency then reversed direction and moved back above the key psychological level. Trading data from CoinGlass showed liquidation patterns changing across the market.
Funding rates across derivatives exchanges moved into negative territory. This pattern typically indicates traders expect prices to move lower in the near term.
Trader Luca noted that liquidation maps hadn’t looked this way in some time. The data revealed overall liquidity thickening around the current spot price.
Gold Market Correction Creates Contrast
Gold experienced sharp losses on the same day, falling more than 5.5% from recent all-time highs. The precious metal now faces the possibility of a double top pattern, which typically signals a bearish trend reversal.
James Stanley, a senior strategist at Forex.com, identified potential downside targets. He suggested gold could retest the $4,000 level if the pattern completes and the neckline breaks.
Trader Crypto Tony suggested Bitcoin and other cryptocurrencies could benefit from gold’s pullback. He described gold as the top of the risk asset chain during uncertain times.
The theory suggests that when gold cools off, capital may flow into riskier assets like crypto. This relationship between traditional and digital assets continues to evolve.
Bitwise Analysis on Capital Rotation
Bitwise released research examining the relationship between gold and Bitcoin markets. The firm’s analysis focused on the size difference between the two asset classes.
Gold’s global market value exceeds $13 trillion. Bitcoin’s market capitalization sits around $1.2 trillion by comparison.
The research showed that a capital rotation of just 3-4% from gold to Bitcoin could double BTC’s price from current levels. This calculation stems from the massive difference in market sizes.
The math works because even small percentage moves from the larger gold market represent substantial dollar amounts. Those amounts would be large relative to Bitcoin’s smaller market cap.
The digital gold narrative has grown stronger as institutional adoption increases. Younger investors increasingly view Bitcoin as offering similar inflation protection to gold but with higher growth potential.
Technical Levels and Market Structure
Analyst Rekt Capital identified the 21-week exponential moving average as the key resistance level for bulls. Bitcoin currently finds resistance at this technical indicator, which is pushing price back into a historical demand area.
The cryptocurrency needs to hold the support zone to maintain the possibility of forming a higher low. Reclaiming the 21-week EMA would position Bitcoin for potential further gains.
Traders identified a large cluster of asks at $116,000 and above. This level could act as a price magnet if momentum shifts positive.
Exchange order book data showed both bids and asks appearing and disappearing as different entities attempted to influence price action. This pattern reflects the ongoing battle between buyers and sellers.
Bitcoin’s finite supply and transparent monetary policy make it increasingly attractive compared to physical gold. The ease of transfer across borders adds another advantage in a digital economy.
Central banks continue diversifying their reserves as inflation concerns persist globally. The concept of digital scarcity has become more relevant in this environment.
A gold to Bitcoin shift could inject hundreds of billions of dollars into the crypto market. This would improve both liquidity and stability while potentially doubling prices.
The asymmetric upside potential means small portfolio allocations to Bitcoin can create outsized returns. If traditional investors adopt this view more widely, Bitcoin’s position in global finance could strengthen.
The gold market’s value at over ten times Bitcoin’s size means marginal reallocation can trigger powerful price movements. BTC currently trades around $108,000 as both markets continue to evolve.
The post Bitcoin Price: Bitwise Research Reveals 4% Gold Rotation Could Double BTC Price appeared first on CoinCentral.


You May Also Like

Santiment Flags Risk as Bullish Talk Rises While BTC Holds $80k

Crypto Institutional Adoption Is Rewriting the Rules of the Global Financial Market


