

Bitcoin Could Drop To $97,500 If This Key On-Chain Level Fails, Glassnode Warns
On-chain analytics firm Glassnode has explained how Bitcoin losing $108,500 could lead to a deeper correction, if the past pattern is to go by.
Bitcoin Is At Risk Of Losing The 0.85 Quantile Level
In its latest weekly report, analytics firm Glassnode has talked about how Bitcoin is currently looking from the perspective of the Supply Quantiles Cost Basis model. This model maps price levels according to the amount of BTC supply that would be lost if the cryptocurrency were to trade at its current price today. There are three supply “quantiles” involved in the indicator: 0.95, 0.85, and 0.75, corresponding to levels where 5%, 15%, and 25% of the supply would be held at a loss, respectively.
Below is the chart shared by Glassnode that shows the trend in the different Bitcoin supply quantiles over the last few years.

As is visible in the graph, Bitcoin surged above the 0.95 quantile during its price rally earlier in the month, as the supply in profit approached the 100% mark during the new all-time high (ATH). With the recent bearish action, however, the cryptocurrency has fallen below the line and is now trading around the 0.85 quantile situated at $108,600. Thus, it would appear that about 15% of the BTC supply is in the red at the moment.
Bitcoin has already faced dips below this mark, so it’s possible that the coin may be at risk of losing the line. “Historically, failure to hold this threshold has signalled structural market weakness and often preceded deeper corrections toward the 0.75 quantile,” explained the analytics firm.
BTC last saw such a decline to the 0.75 quantile during the consolidation period in mid-2024. Currently, this level is equivalent to $97,500. It now remains to be seen whether the asset can maintain above the 0.85 quantile, and if not, whether a retest of the 0.75 quantile will take place.
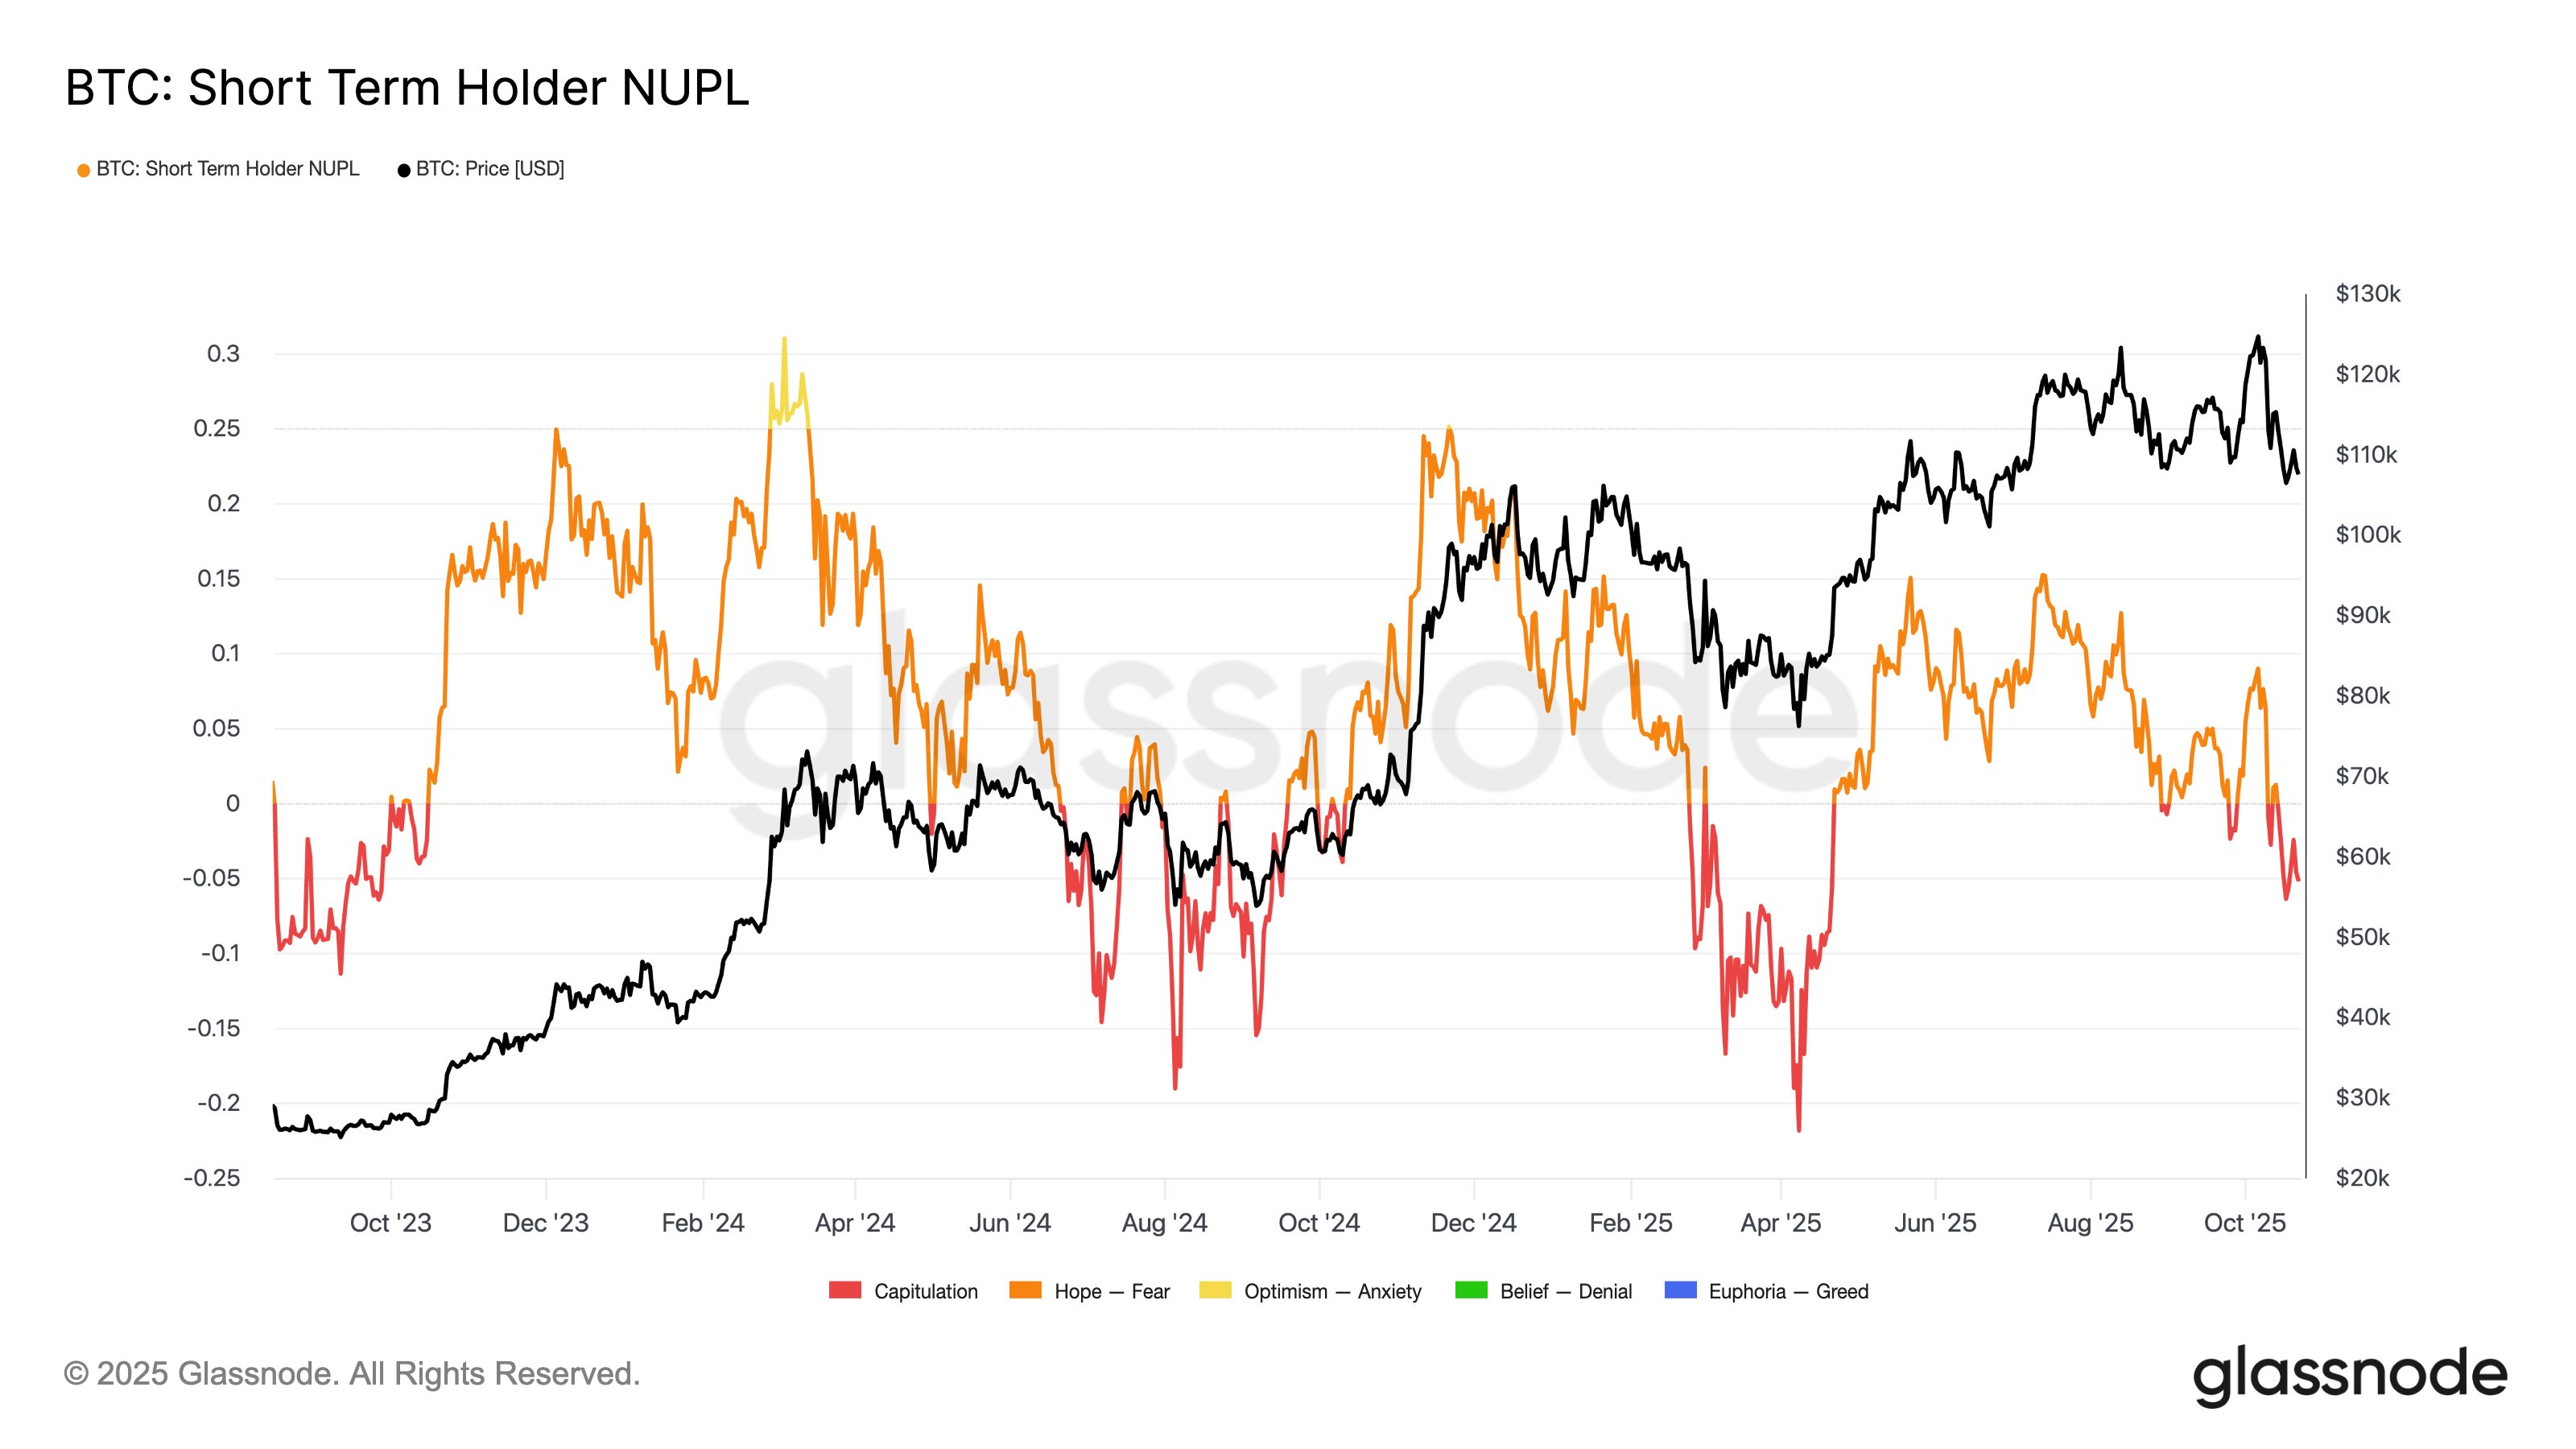
The 0.95 quantile isn’t the only level that Bitcoin has lost during the recent drawdown; its price has also dropped below the average cost basis of the short-term holders (STHs) located at $113,100. STHs here refer to the BTC investors who purchased their coins within the past 155 days.
This group is considered to represent the fragile side of the market, prone to making panic moves during times of volatility. With BTC dropping below the cost basis of the cohort, its members are now underwater. “Historically, this structure often precedes the onset of a mid-term bearish phase, as weaker hands begin to capitulate,” noted Glassnode.
In an X post, the analytics firm has shared a chart that puts into perspective the net unrealized loss held by the Bitcoin STHs right now.
BTC Price
Bitcoin hasn’t been able to sustain a recovery recently as its price is still trading around $109,100.


You May Also Like

Trump vows to investigate UFO scientist deaths —but experts warn it's a trap

Exclusive interview with Smokey The Bera, co-founder of Berachain: How the innovative PoL public chain solves the liquidity problem and may be launched in a few months


