

The data comprehensively analyzes the capital flows behind the trillion-dollar growth of stablecoins. If altcoins did not increase, where did the money go?
Author: Frank, PANews
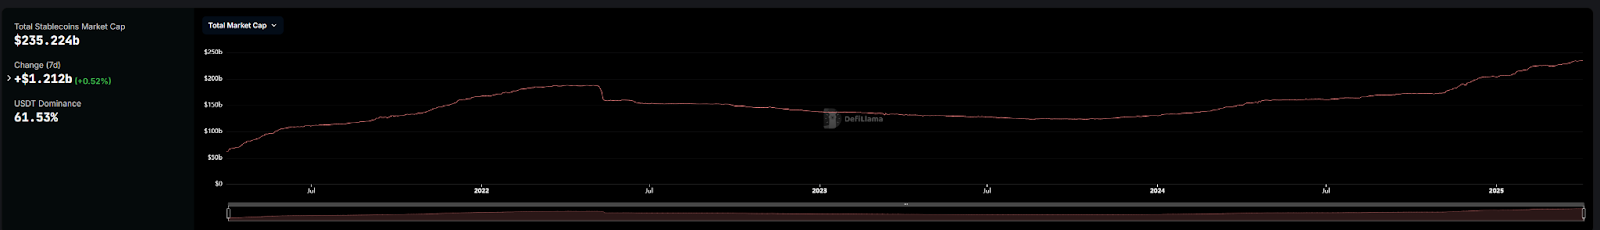
Since 2024, the global stablecoin market has exceeded 235 billion US dollars with a growth rate of 80.7%, and USDT and USDC continue to dominate the market with a growth contribution rate of 86%. But what is puzzling is that the hundreds of billions of dollars of incremental funds deposited on the Ethereum and Tron chains have not driven the simultaneous outbreak of the altcoin market as in previous cycles. Data shows that every additional $1 of stablecoins in this round only leverages $1.5 of altcoin market value growth, which is 82% less than the previous bull market.
In this article, PANews will analyze the ultimate crypto question brought about by the growth of stablecoins through a comprehensive data analysis: Where did the money go? As the balance of exchanges skyrocketed and the amount of pledged funds in DeFi protocols climbed, the over-the-counter transactions of traditional financial institutions, the penetration of cross-border payment scenarios, and the demand for currency substitution in emerging markets are quietly reshaping the capital flow map of the cryptocurrency world.
Stablecoin market value increased by $100 billion, with Ethereum and TRON still contributing 80% of the growth
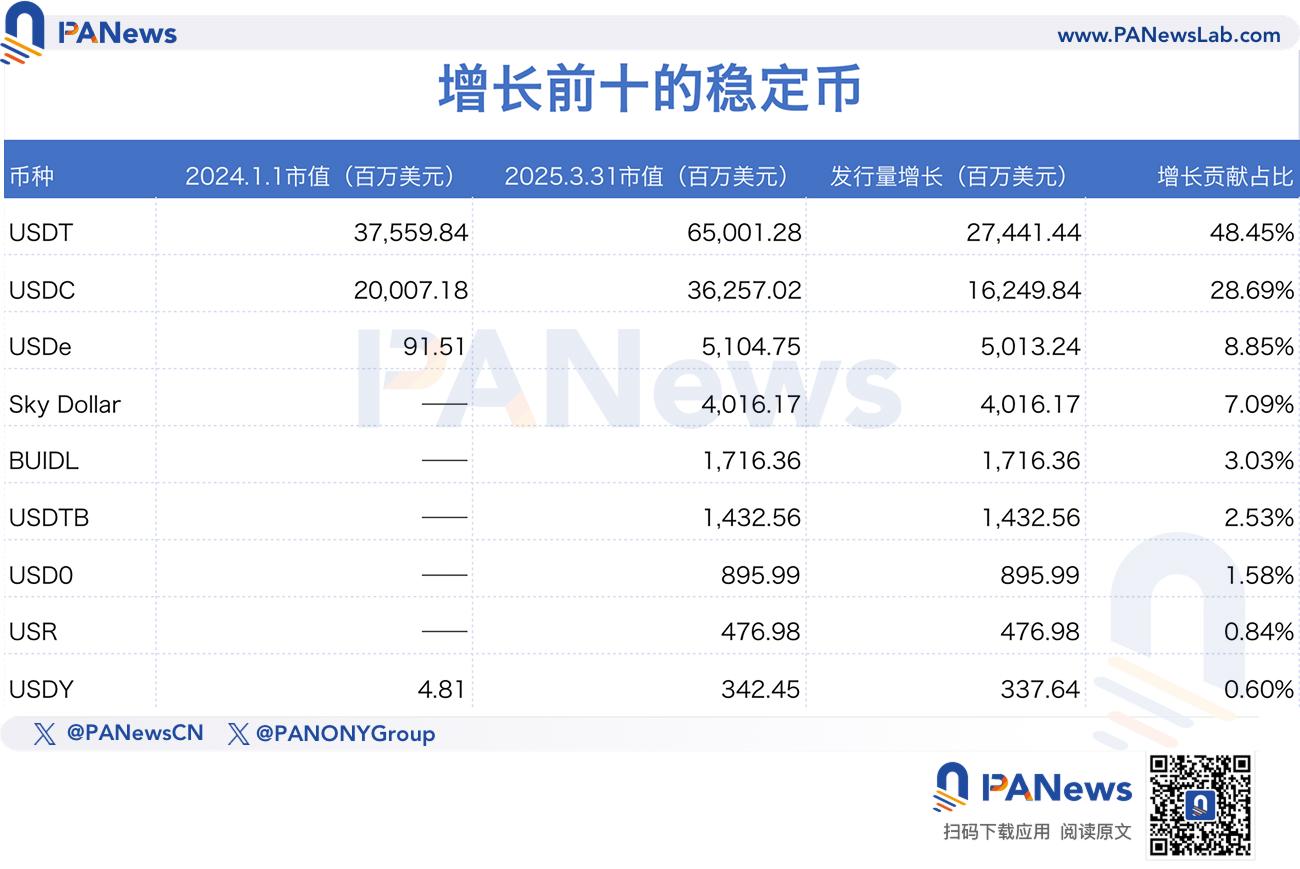
According to data from defillama, from 2024 to now, the issuance of stablecoins has increased from US$130 billion to US$235 billion, with an overall increase of 80.7%. Among them, the main growth still comes from the two stablecoins UDST and USDC.
On January 1, 2024, USDT's issuance volume was $91 billion. As of March 31, 2025, USDT's issuance volume was $144.6 billion, an increase of about $53.6 billion, accounting for 51% of the growth rate. USDC's issuance volume increased from $23.8 billion to $60.6 billion during the same period, accounting for about 35% of the growth rate. These two stablecoins not only accounted for 87% of the market share, but also contributed 86% of the growth rate.
Looking at the on-chain data, Ethereum and Tron are still the two public chains with the largest issuance of stablecoins, with Ethereum accounting for 53.62% and Tron accounting for about 28.37%, for a total of 81.99%.
Among them, the increase in Ethereum's stablecoins from January 1, 2024 to April 3, 2025 is about 58 billion US dollars, with a growth rate of 86%, which is basically the same as the issuance growth rate of USDT and UDSC. Tron's growth rate is about 34%, which is lower than the overall growth rate of stablecoins.
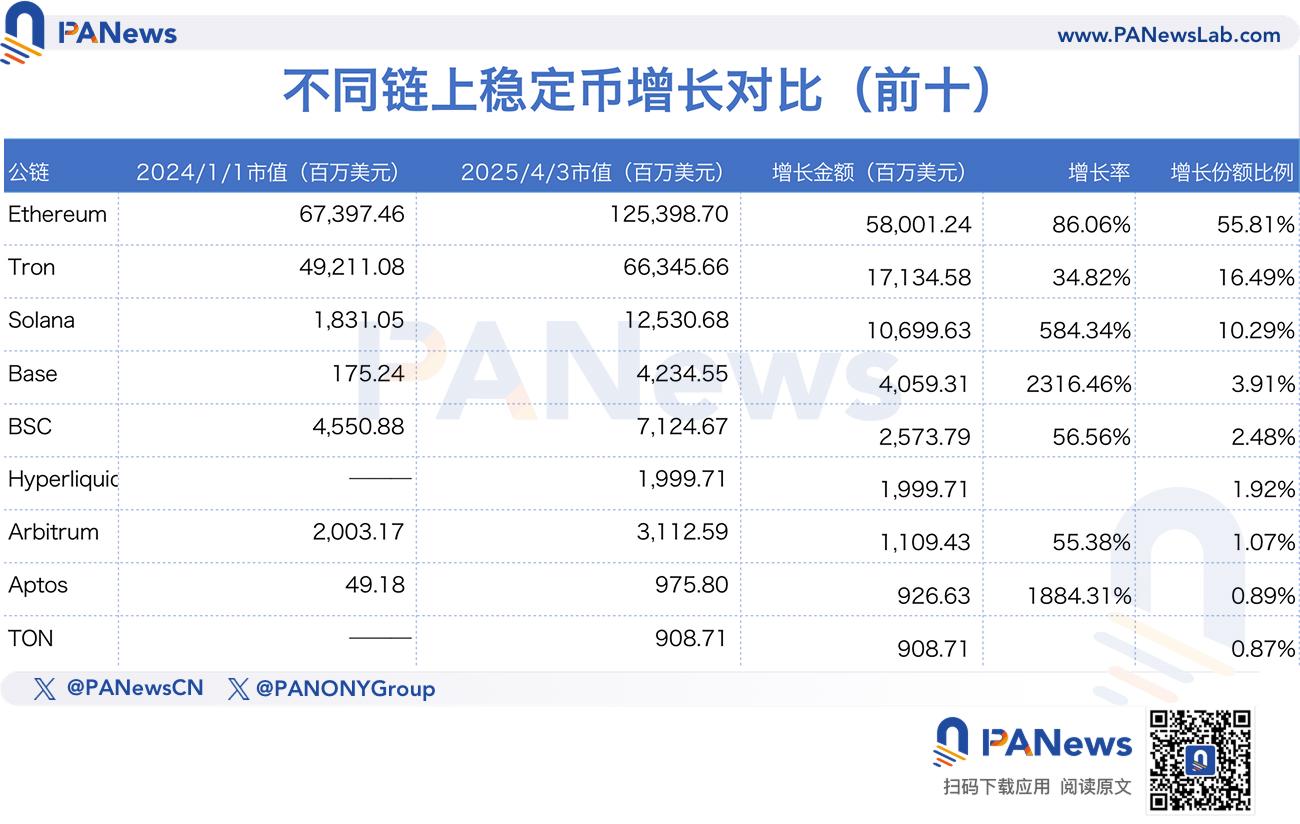
Solana ranked third, with an increase of $12.5 billion in issuance over the same period, a growth rate of 584.34%. Base ranked fourth, with an increase of $4 billion in issuance, a growth rate of 2316.46%.
Among the top ten, Hyperliquid, TON, and Berachain have only started issuing stablecoins in the past year. These three companies have added about $3.8 billion in stablecoin issuance, contributing 3.6% of the growth share of stablecoins. Overall, Ethereum and Tron are still the main markets for stablecoins.
Every $1 of new capital only leverages $1.5 of altcoin market value
Although the on-chain growth of stablecoins is rapid, the market value growth of altcoins during the same period is not ideal.
In comparison, in March 2020, the overall market value of altcoins was about $39.8 billion (excluding BTC and ETH). By May 2021, the market value of altcoins had risen to $813.5 billion, an increase of about 19.43 times. During the same period, the data for stablecoins grew from $6.14 billion to $99.2 billion, an increase of about 15 times, which was basically synchronized. The increase was basically synchronized.
During this round of bull market, the overall market value of stablecoins increased by 80%, but the overall market value of altcoins increased by only 38.3% during the same period, an increase of approximately US$159.9 billion.
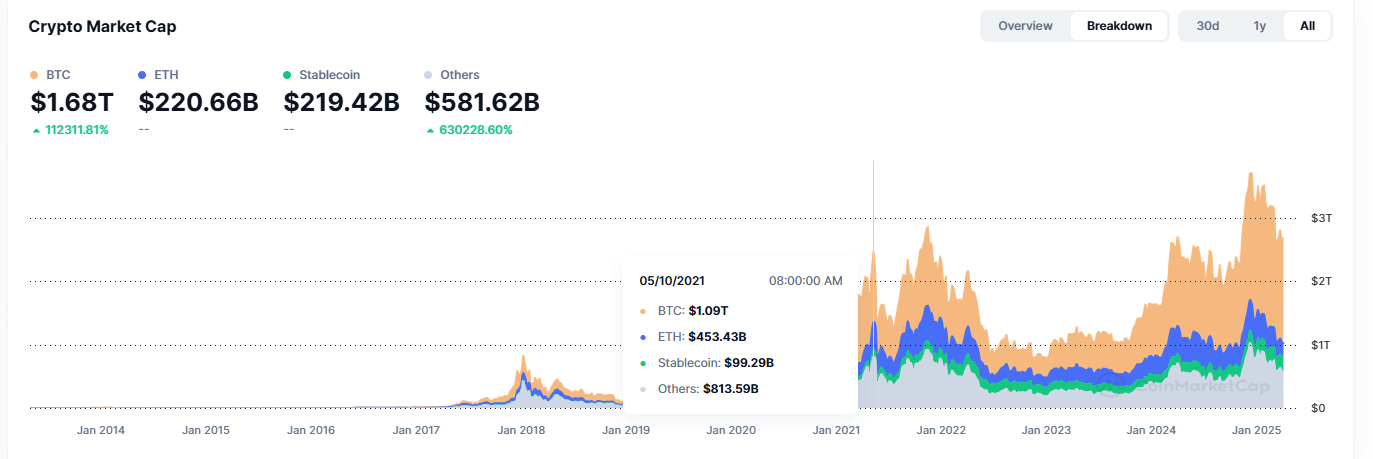
Looking back, in the 2020-2021 cycle, for every $1 increase in stablecoins, the overall market value of altcoins increased by $8.3. But in the 2024-2025 cycle, for every $1 increase in stablecoins, the market value of altcoins only increased by $1.5. This ratio has shrunk significantly, which means that the newly added stablecoins do not seem to be used to purchase altcoins.
Where did the money go? This is a key question.
Public chain landscape reshuffle: Ethereum and Tron defend their position, while Solana and Base break through and grow
Intuitively speaking, the MEME craze on Solana has always led this round of bull market. However, during the hype of MEME, the SOL trading pair was basically used, and there was not much room for stablecoins to participate. And from the results analyzed in the previous article, the growth of stablecoins still mainly stays on Ethereum.
Therefore, to find out where the growth of stablecoins has gone, we still need to analyze the trends of major stablecoins such as Ethereum or USDT, USDC, etc.
Before the analysis, perhaps we can list several possible directions, which are also the common speculations in the market about the direction of stablecoins. For example, stablecoins are more used in payment scenarios, staking income, value storage, etc.
Let's first look at the stablecoin transactions on Ethereum. From the figure below, we can see that the trading volume of stablecoins fluctuates regularly, just like a heartbeat. Behind this fluctuation, there may be a pattern in the use of stablecoins.
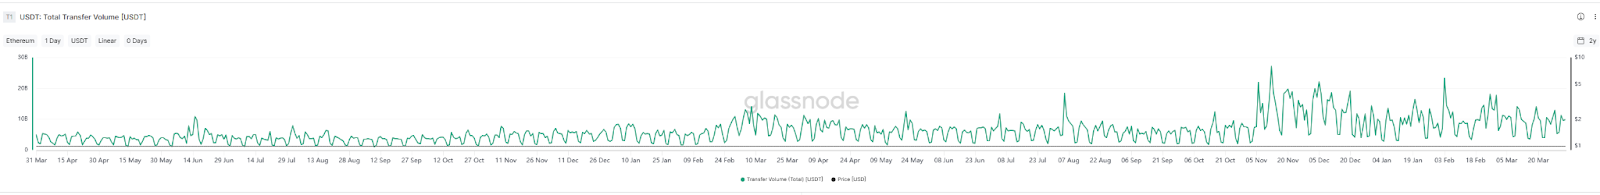
When the period is shortened, it can be clearly seen that the pattern of this fluctuation is 5+2 fluctuations, that is, 2 days of depression and 5 days of peak. After observation, it can be seen that the trough period is the weekend, and the peak period is basically from Monday to Wednesday, gradually rising, and gradually falling on Thursday and Friday. This obvious volatility pattern seems to at least indicate that the transaction initiators of these stablecoins are mainly from institutions or enterprises. After all, if it is dominated by consumer payment scenarios, it should not show this kind of volatility.
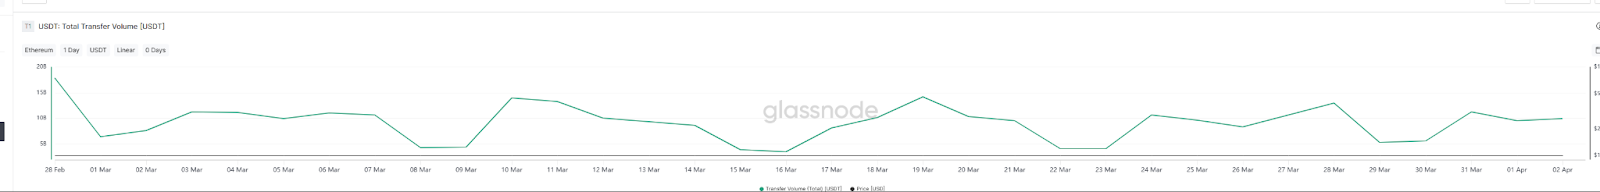
In addition, judging from the daily transaction frequency, the peak daily transfer frequency of USDT on Ethereum does not exceed 300,000 times, and the transfer frequency and average transfer amount on weekends are usually much lower than on weekdays, which further confirms the above inference.
USDT pours into exchanges, USDC settles in DeFi protocols
Judging from the distribution of holdings, the exchange balance of USDT has increased significantly in the past year. The balance of exchanges was 15.2 billion on January 1, 2024, and by April 2, 2025, this number increased to 40.9 billion, an increase of 25.7 billion US dollars, a growth of 169%. This increase is much higher than the 80.7% increase in the overall issuance of stablecoins, and accounts for 48% of the increase in USDT issuance during the same period.
That is to say, in the past year or so, about half of the new issuance of USDT has flowed into exchanges.
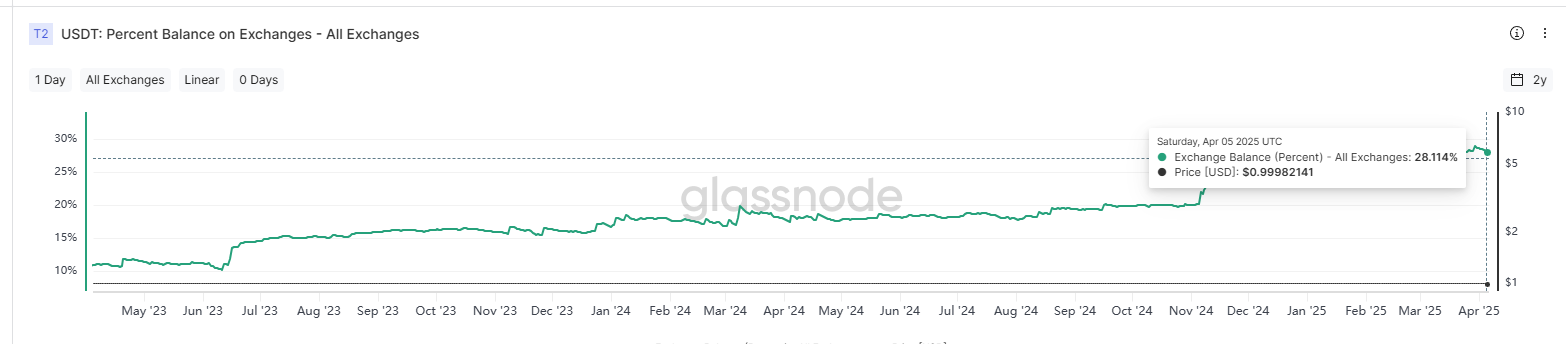
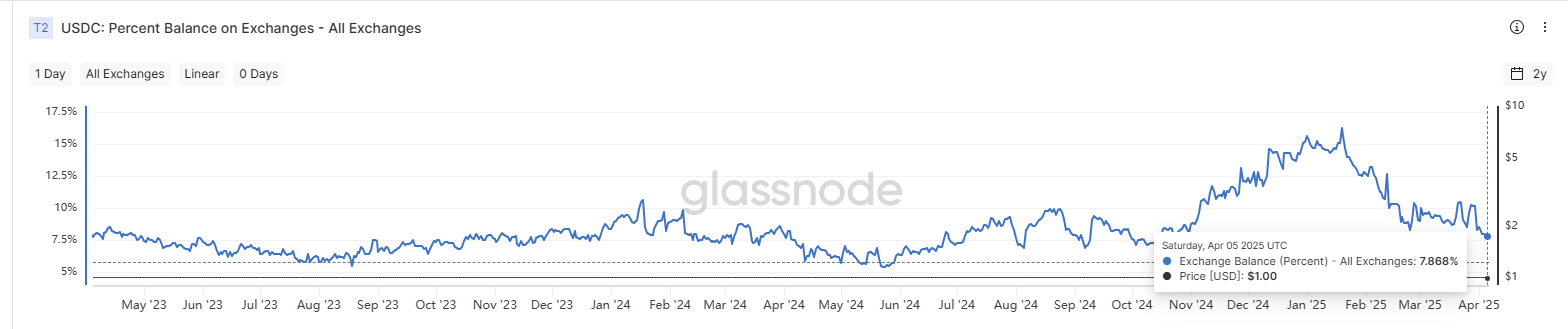
However, the situation of USDC in the same period is quite different. On January 1, 2024, the exchange holdings of USDC were about 2.06 billion, and by April 2, 2025, this number increased to 4.98 billion. During the same period, the issuance of USDC increased by 36.8 billion, and only 7.9% of the new issuance flowed into the exchange. The overall balance of the exchange accounted for only 8.5%, which is a big gap compared with USDT's 28.4%.
Most of the new issuance of USDT flowed into the exchanges, but the new trading volume of USDC did not enter the exchanges.
So where does the new flow of USDC go? This may explain to some extent where the funds in the market flow.
From the perspective of the address holding USDC, the top few USDC addresses are basically from DeFi protocols. Taking Ethereum as an example, the largest USDC address is Sky (MakerDAO), which holds 4.8 billion USDC, accounting for about 11.9%. In July 2024, the number of USDC held by this address was only 20 million, which increased by 229 times in less than a year. Sky's USDC is mainly used as a collateral asset for its stablecoins DAI and USDS. Overall, the growth of USDC at this address still represents the demand for stablecoins due to the growth of TVL of DeFi protocols.
AAVE is the fourth largest USDC holding address on Ethereum. On January 1, 2024, AAVE held approximately 45 million USDC. By the peak point on March 12, 2025, the USDC holdings of this address increased to 1.32 billion, an increase of approximately US$1.275 billion, accounting for 7.5% of the new issuance of USDC on Ethereum.
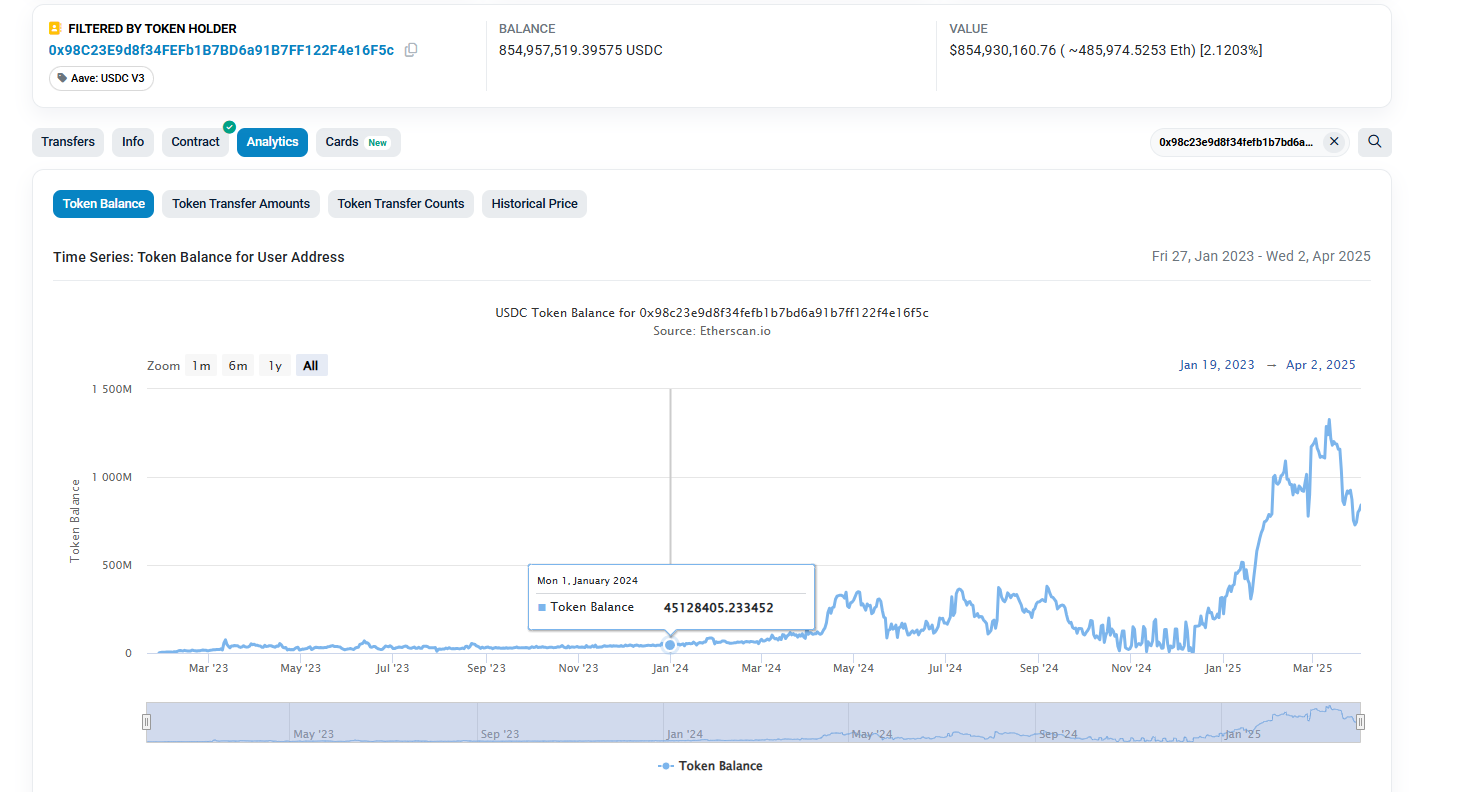
From this perspective, the increase in USDC on Ethereum is mainly due to the growth of staking products. At the beginning of 2024, the total TVL of Ethereum was about 29.7 billion US dollars. Although it has declined recently, there is still 49 billion US dollars in stock (the TVL at the peak reached 76 billion US dollars). Calculated at 49 billion, the TVL growth rate on Ethereum can also reach 64.9%, which is much greater than the growth rate of altcoins last year and is close to the overall growth rate of stablecoins.
However, in terms of scale, although the TVL on Ethereum has increased by $19.3 billion, it is still far behind the growth of Ethereum stablecoins, which has increased by $58 billion. Apart from some new issuances contributed by exchanges, pledge protocols have not absorbed all the increase in these stablecoins.
The rise of new scenarios: paradigm shift from cross-border payments to institutional transactions
In addition to the growing demand for stablecoins from DeFi, consumer payments, cross-border remittances, and over-the-counter transactions by financial institutions may also be new demands for the growth of stablecoins.
According to multiple official documents from Circle, stablecoins are gradually showing their potential in cross-border remittances, consumer payments and other scenarios. According to a report by Rise, about 30% of global remittances are made through stablecoins. This proportion is particularly significant in Latin America and sub-Saharan Africa. Retail and professional stablecoin transfers in Latin America and sub-Saharan Africa increased by more than 40% year-on-year between July 2023 and June 2024.
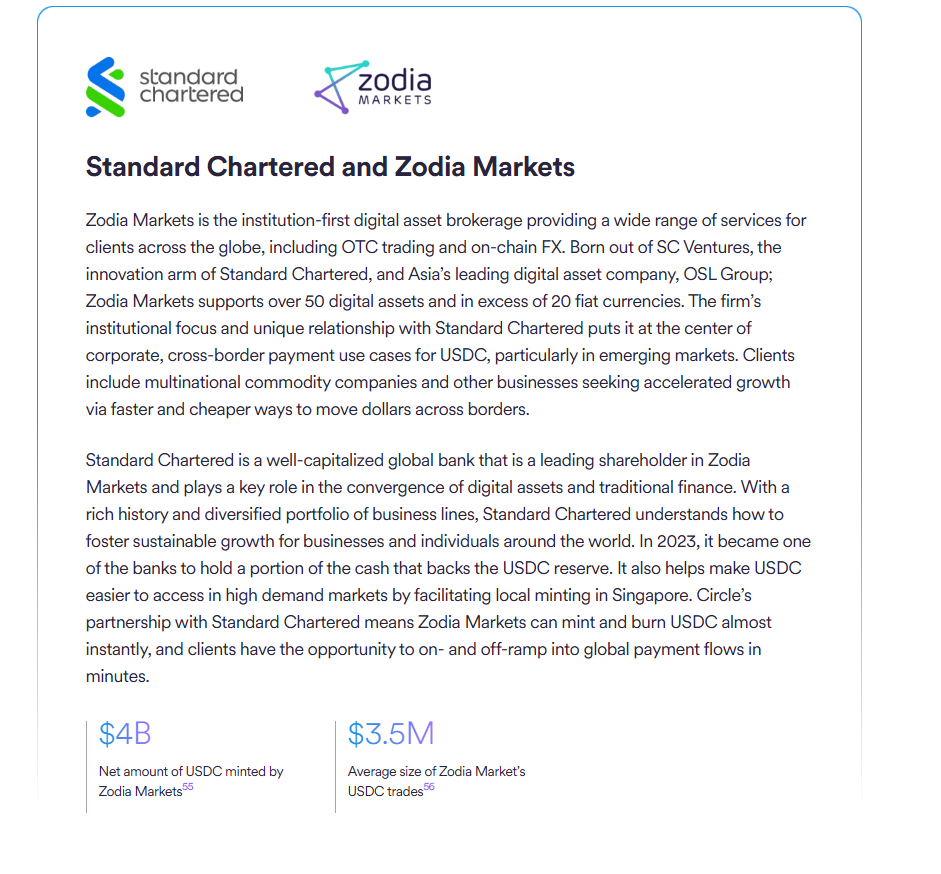
According to a report released by Circle, the net amount of USDC minted by Zodia Markets, a subsidiary of Standard Chartered Bank, has reached US$4 billion in 2024 (Zodia Markets is an institutional digital asset brokerage company that provides services including over-the-counter trading and on-chain foreign exchange to global customers).
Customers of Lemon, another Latin American retail payment company, hold more than $137 million in USDC. Users of the platform mainly use stablecoins for retail payments.
In addition to the new demand caused by different scenarios, the different ecological structures of each chain have also created different stablecoin demands. For example, the MEME craze on the Solana chain has stimulated the trading demand of DEX. According to incomplete statistics from PANews, the TVL of USDC (top 100) trading pairs on the Solana chain is about 2.2 billion US dollars. According to the rule that USDC accounts for half of the volume, the amount of deposited funds in this part is about 1.1 billion USDC, accounting for 8.8% of the issuance of USDC on the Solana chain.
The crypto market has shifted from a "speculative bubble" to a "new financial product"
After analyzing the stablecoins, PANews found that it seems difficult to find a direction that is the main driving force for the growth of stablecoins. It is also impossible to explain where the money in the market has gone. But looking back, we may get a series of complex conclusions.
1. The market value of stablecoins is growing, but it is clear that these funds have not flowed into the altcoin market on a large scale, becoming the initial driving force for the arrival of the altcoin season.
2. From the perspective of the Ethereum market, half of the growth of the main stablecoin USDT still flows into exchanges, but it seems more likely to be used to buy BTC (because the markets of altcoins and Ethereum have not risen significantly) or financial products in exchanges. The remaining growth demand may be absorbed by the DeFi protocol. Overall, the funds flowing into Ethereum are more concerned with the stable returns of pledge and lending protocols. The attraction of the crypto market to traditional funds may no longer be crazy ups and downs, but a new type of financial product.
3. Changes in new scenarios. Traditional financial institutions such as Standard Chartered Bank have entered the crypto market, which has also become one of the new demands for stablecoins. In addition, the number of scenarios where underdeveloped regions choose to adopt stablecoins due to backward infrastructure and unstable exchange rates of their own currencies is also increasing. However, there is still no complete statistical result for this part of the data, and we do not know the specific share.
4. Stablecoins have different narrative needs on different chains. For example, Solana’s growth demand may come from the rising trading popularity of MEME. The growth of new public chains such as Hyperliquid, Berachain, and TON also brings certain funding needs.
Overall, the undercurrent of this capital migration reveals that the crypto market is undergoing a paradigm shift. Stablecoins have broken through the boundaries of a simple trading medium and become a value pipeline connecting traditional finance and the crypto world. On the one hand, altcoins have not received a large-scale transfusion due to the growth of stablecoins. On the other hand, the financial management needs of institutional funds, the rigid payment needs of emerging markets, and the maturity of on-chain financial infrastructure are pushing stablecoins to a broader value-bearing stage. This may indicate that the cryptocurrency market is quietly moving towards a historic turning point from "speculation-driven" to "value precipitation".


You May Also Like

Zcash 2027: Analyzing Quantum Roadmap Aiming to Turn ZEC Into ‘Privacy-First Mastercard’

Zoomex Warns Traditional Liquidity Metrics Are Failing in the Age of AI Trading


