Crypto liquidations within the past 24 hours have reached $825 million, with long positions dominating. The market crash comes as major altcoins begin to drop in value. On Oct. 30, total liquidations across the crypto market have reached $825.4 million,…Crypto liquidations within the past 24 hours have reached $825 million, with long positions dominating. The market crash comes as major altcoins begin to drop in value. On Oct. 30, total liquidations across the crypto market have reached $825.4 million,…

Crypto market sheds $825M as altcoins start to drop

Crypto liquidations within the past 24 hours have reached $825 million, with long positions dominating. The market crash comes as major altcoins begin to drop in value.

Summary
  • The crypto market saw a massive $825.4 million in total liquidations on Oct. 30, with long positions making up over 79% of the total. Bitcoin led the losses with $310.3 million in long liquidations.
  • The market cap dropped 1.6% to $3.8 trillion as Bitcoin, Ethereum, and major altcoins like Solana and XRP saw sharp declines.
  • The downturn was fueled by post-Fed rate cut uncertainty, excessive leverage, and fading investor momentum despite new ETF launches.

On Oct. 30, total liquidations across the crypto market have reached $825.4 million, growing closer to a massive $1 billion wipeout. Long positions contributed to the majority of liquidations, making up $656.7 million. Meanwhile, short positions have amounted to $168.9 million.

Among the positions, Bitcoin (BTC) long positions have seen the most liquidations compared to any other asset. Bitcoin long positions have reached $310.3 million, far overpowering Bitcoin short positions which stand at only $59.2 million.

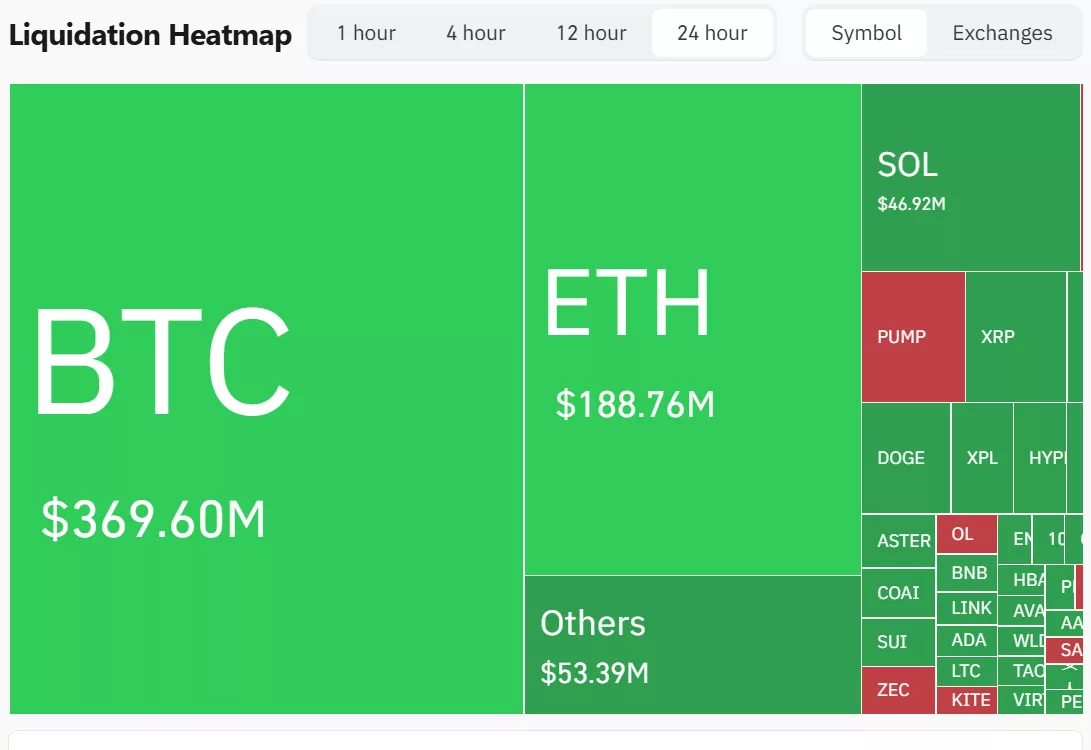
In the past hour, the industry has lost nearly $10 million in liquidations. Bitcoin liquidations dominate the heatmap, reaching $2.88 million, while Ethereum (ETH) has seen $2.41 million in liquidations. Other altcoins have reached $815,650, meanwhile Solana (SOL) holds up with $481,430 in liquidations.

The crypto market recorded $825 million in liquidations, mostly coming from Bitcoin positions | Source: Coinglass

The mass liquidations have put a dent in the overall crypto market cap, which has dropped by 1.6% as it slips even farther below the $4 trillion mark. On Oct. 30, the overall crypto market cap has fallen to $3.8 trillion. Meanwhile, its 24 hour trading volume stands at $192 billion.

The wipeout was triggered by a chain of major tokens turning red over the past few hours. Bitcoin is currently trading at the edge of $110,000, as it drops 2.4% within the past 24 hours. Meanwhile, Ethereum has already fallen off its $4,000 high, having dipped by 2.5% to $3,899.

Despite two Solana ETFs recently launching on the market, Solana has fallen deeper below $200 after briefly reaching $201. At press time, the token has dipped slightly by 0.9% as it inches nearer to the $190 mark. Similarly, XRP (XRP) has lost about 3.5% and is currently trading hands at $2.56.

Smaller altcoins like Pi Network (PI) and Aster (ASTER) have also taken the brunt of the crash, slipping by 2.1% and 5% respectively. Dogecoin (DOGE) has fallen by 2.1% to just around $0.189 within the past day.

Why is the crypto market crashing right now?

The recent crypto market crash is mostly driven by a combination of macroeconomic pressures, structural vulnerabilities and leveraged trading dynamics. Heightened uncertainty around monetary policy has made non-yielding assets like crypto even less attractive to investors.

Following the Fed’s decision to slash interest rates by 0.25%, which was in line with analyst expectations, investors were quick to jump on the strategy of “buy the rumor and sell the news,” which usually sees prices going higher in anticipation of a certain event before mellowing out once the news has passed. This means that market momentum surrounding the Fed rate cut has died down.

Moreover, the crypto market is laden with excessive leverage and thin liquidity. A large portion of trading volume comes from derivatives which enable huge exposure with little capital. When prices trickle down, liquidation cascades were triggered leading to forced closures of leveraged long positions pushed prices further down, which triggered more forced liquidations.

Despite the release of new crypto ETFs, such as the Bitwise Solana Staking ETF, Grayscale’s Solana Staking ETF and Canary’s Litecoin ETF and HBAR ETF, the momentum surrounding the launch appears to have waned as these tokens have dipped instead of going higher.

Market Opportunity
Major Logo
Major Price(MAJOR)
$0.12325
$0.12325$0.12325
-1.69%
USD
Major (MAJOR) Live Price Chart
Disclaimer: The articles reposted on this site are sourced from public platforms and are provided for informational purposes only. They do not necessarily reflect the views of MEXC. All rights remain with the original authors. If you believe any content infringes on third-party rights, please contact service@support.mexc.com for removal. MEXC makes no guarantees regarding the accuracy, completeness, or timeliness of the content and is not responsible for any actions taken based on the information provided. The content does not constitute financial, legal, or other professional advice, nor should it be considered a recommendation or endorsement by MEXC.

You May Also Like

Microsoft Corp. $MSFT blue box area offers a buying opportunity

Microsoft Corp. $MSFT blue box area offers a buying opportunity

The post Microsoft Corp. $MSFT blue box area offers a buying opportunity appeared on BitcoinEthereumNews.com. In today’s article, we’ll examine the recent performance of Microsoft Corp. ($MSFT) through the lens of Elliott Wave Theory. We’ll review how the rally from the April 07, 2025 low unfolded as a 5-wave impulse followed by a 3-swing correction (ABC) and discuss our forecast for the next move. Let’s dive into the structure and expectations for this stock. Five wave impulse structure + ABC + WXY correction $MSFT 8H Elliott Wave chart 9.04.2025 In the 8-hour Elliott Wave count from Sep 04, 2025, we saw that $MSFT completed a 5-wave impulsive cycle at red III. As expected, this initial wave prompted a pullback. We anticipated this pullback to unfold in 3 swings and find buyers in the equal legs area between $497.02 and $471.06 This setup aligns with a typical Elliott Wave correction pattern (ABC), in which the market pauses briefly before resuming its primary trend. $MSFT 8H Elliott Wave chart 7.14.2025 The update, 10 days later, shows the stock finding support from the equal legs area as predicted allowing traders to get risk free. The stock is expected to bounce towards 525 – 532 before deciding if the bounce is a connector or the next leg higher. A break into new ATHs will confirm the latter and can see it trade higher towards 570 – 593 area. Until then, traders should get risk free and protect their capital in case of a WXY double correction. Conclusion In conclusion, our Elliott Wave analysis of Microsoft Corp. ($MSFT) suggested that it remains supported against April 07, 2025 lows and bounce from the blue box area. In the meantime, keep an eye out for any corrective pullbacks that may offer entry opportunities. By applying Elliott Wave Theory, traders can better anticipate the structure of upcoming moves and enhance risk management in volatile markets. Source: https://www.fxstreet.com/news/microsoft-corp-msft-blue-box-area-offers-a-buying-opportunity-202509171323
Share
BitcoinEthereumNews2025/09/18 03:50
WTI drifts higher above $59.50 on Kazakh supply disruptions

WTI drifts higher above $59.50 on Kazakh supply disruptions

The post WTI drifts higher above $59.50 on Kazakh supply disruptions appeared on BitcoinEthereumNews.com. West Texas Intermediate (WTI), the US crude oil benchmark
Share
BitcoinEthereumNews2026/01/21 11:24
Fed forecasts only one rate cut in 2026, a more conservative outlook than expected

Fed forecasts only one rate cut in 2026, a more conservative outlook than expected

The post Fed forecasts only one rate cut in 2026, a more conservative outlook than expected appeared on BitcoinEthereumNews.com. Federal Reserve Chairman Jerome Powell talks to reporters following the regular Federal Open Market Committee meetings at the Fed on July 30, 2025 in Washington, DC. Chip Somodevilla | Getty Images The Federal Reserve is projecting only one rate cut in 2026, fewer than expected, according to its median projection. The central bank’s so-called dot plot, which shows 19 individual members’ expectations anonymously, indicated a median estimate of 3.4% for the federal funds rate at the end of 2026. That compares to a median estimate of 3.6% for the end of this year following two expected cuts on top of Wednesday’s reduction. A single quarter-point reduction next year is significantly more conservative than current market pricing. Traders are currently pricing in at two to three more rate cuts next year, according to the CME Group’s FedWatch tool, updated shortly after the decision. The gauge uses prices on 30-day fed funds futures contracts to determine market-implied odds for rate moves. Here are the Fed’s latest targets from 19 FOMC members, both voters and nonvoters: Zoom In IconArrows pointing outwards The forecasts, however, showed a large difference of opinion with two voting members seeing as many as four cuts. Three officials penciled in three rate reductions next year. “Next year’s dot plot is a mosaic of different perspectives and is an accurate reflection of a confusing economic outlook, muddied by labor supply shifts, data measurement concerns, and government policy upheaval and uncertainty,” said Seema Shah, chief global strategist at Principal Asset Management. The central bank has two policy meetings left for the year, one in October and one in December. Economic projections from the Fed saw slightly faster economic growth in 2026 than was projected in June, while the outlook for inflation was updated modestly higher for next year. There’s a lot of uncertainty…
Share
BitcoinEthereumNews2025/09/18 02:59