Solana Price Prediction: SOL Bulls Target $180 Levels If Key Support Holds

Highlights:
- The Solana price is up 1% to $139, despite the daily trading volume slipping 40%.
- The recent Canary Capital and Fidelity launch of Spot SOL ETFs has boosted the market sentiment.
- The technical outlook still portrays bearish sentiment, as bulls attempt a breakout, if key support at $128 holds.
The Solana price is currently up 1% to exchange hands at $139, after reaching one of the main support levels the day before. However, its daily trading volume is still roaring in the red zone, down 40%, indicating reduced market activity. On Tuesday, Canary Capital and Fidelity revealed their spot Solana Exchange Traded Funds (ETFs), SOLC and FSOL. This has boosted market sentiment as institutional interest in SOL has increased. The technical outlook indicates that SOL may rebound if it maintains its position above the key support level of 128.
Fidelity is the fourth manager to introduce an SOL ETF and the first manager of the company to include staking. These consecutive launches point to the growing institutional attention towards investment products built on Solana. In other words, it is a positive indicator of the long-term prospects of Solana and its native currency.
A quick look at the derivatives market, Solana price has seen a slight surge in open interest by 0.31% to $7.29 billion. Despite the 35.89% drop in volume, the options open interest has soared 1.88% indicating growing retail demand. The long-to-short ratio also reads at 0.9845, as the bulls are attempting a recovery.
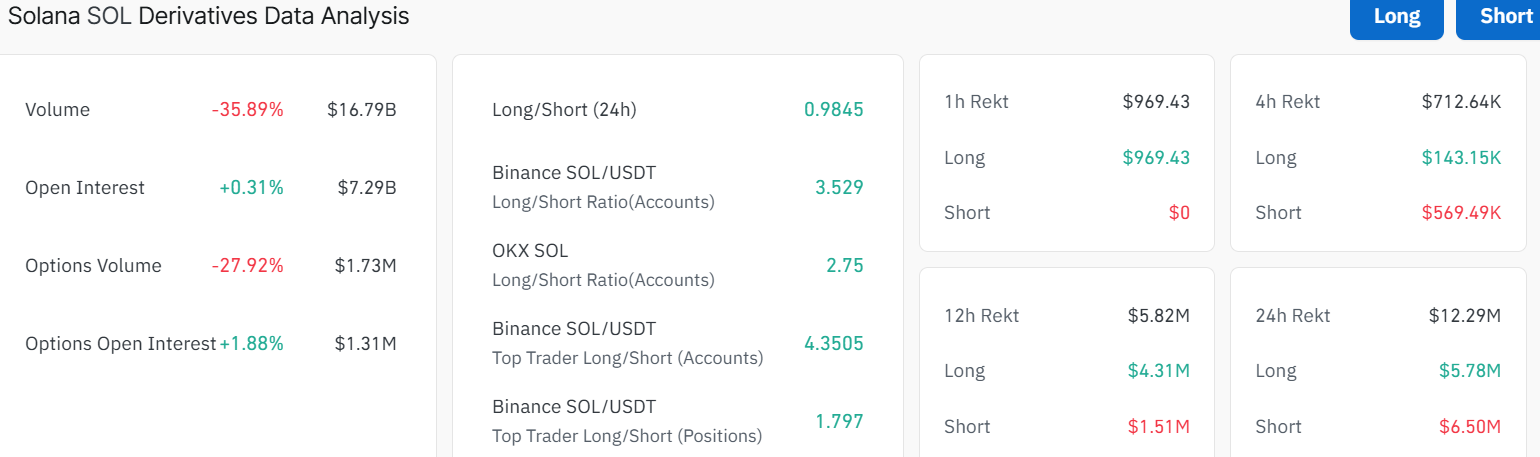 SOL Derivatives Data Analysis: CoinGlass
SOL Shows Mixed Reactions as Bearish Momentum Tightens
Despite the drop, the SOL price chart suggests this could be a short-term dip before a bigger move up. Looking at the daily chart, Solana price is trading within a falling channel, as the bulls aim to break out. The bears have been in control, reinforced by the 50-day ($183) and 200-day ($180) SMA acting as immediate resistance zones.
Currently, the price is testing the $139 mark, with the immediate support floor around $128. If it holds, the support zone holds, and Solana price could bounce and continue rising. The next big target is between $180 and $183. This is where a lot of buy orders (liquidity) might be waiting, which might push the price higher.
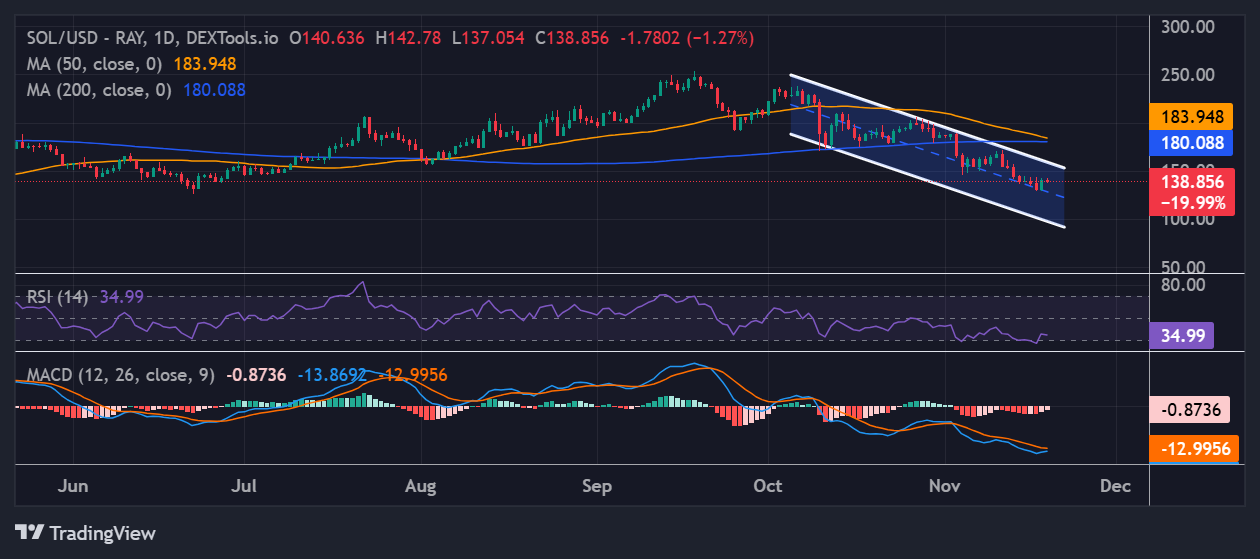 SOL/USD 1-day chart: TradingView
The RSI (Relative Strength Index) is at 34.99. This means Solana isn’t oversold yet but has room to fall more before bouncing. That said, the bulls may ignite a buy-back campaign, which may see Solana price rebounding above resistance zones.
Looking ahead, a close above the $180–$183 level would confirm renewed buying strength and set the stage for a move toward the $250 resistance zone. However, if the resistance zones prove too strong, further downside towards $128 could be imminent. A drop below this zone will see the bears tumble the Solana price towards $118.
Meanwhile, with the recent launch of Spot SOL ETFs, the long-term broader price structure favors a bullish breakout, especially if it manages to reclaim $180. In the meantime, it’s a wait-and-see game on whether the crypto market will flip bullish.
eToro Platform
Best Crypto Exchange
- Over 90 top cryptos to trade
- Regulated by top-tier entities
- User-friendly trading app
- 30+ million users
eToro is a multi-asset investment platform. The value of your investments may go up or down. Your capital is at risk. Don’t invest unless you’re prepared to lose all the money you invest. This is a high-risk investment, and you should not expect to be protected if something goes wrong.
You May Also Like

CEO Sandeep Nailwal Shared Highlights About RWA on Polygon

Velo protocol Integrates SumPlus to Power AI-Driven Finance