Solana crypto forecasting: is SOL nearing a tactical bottom?
 Solana crypto forecasting has turned more complex in recent days, as the token slides deeper into a corrective phase while macro crypto metrics still look relatively healthy. Traders are now trying to understand whether this is a classic shakeout before the next leg higher or the beginning of a longer downtrend.
 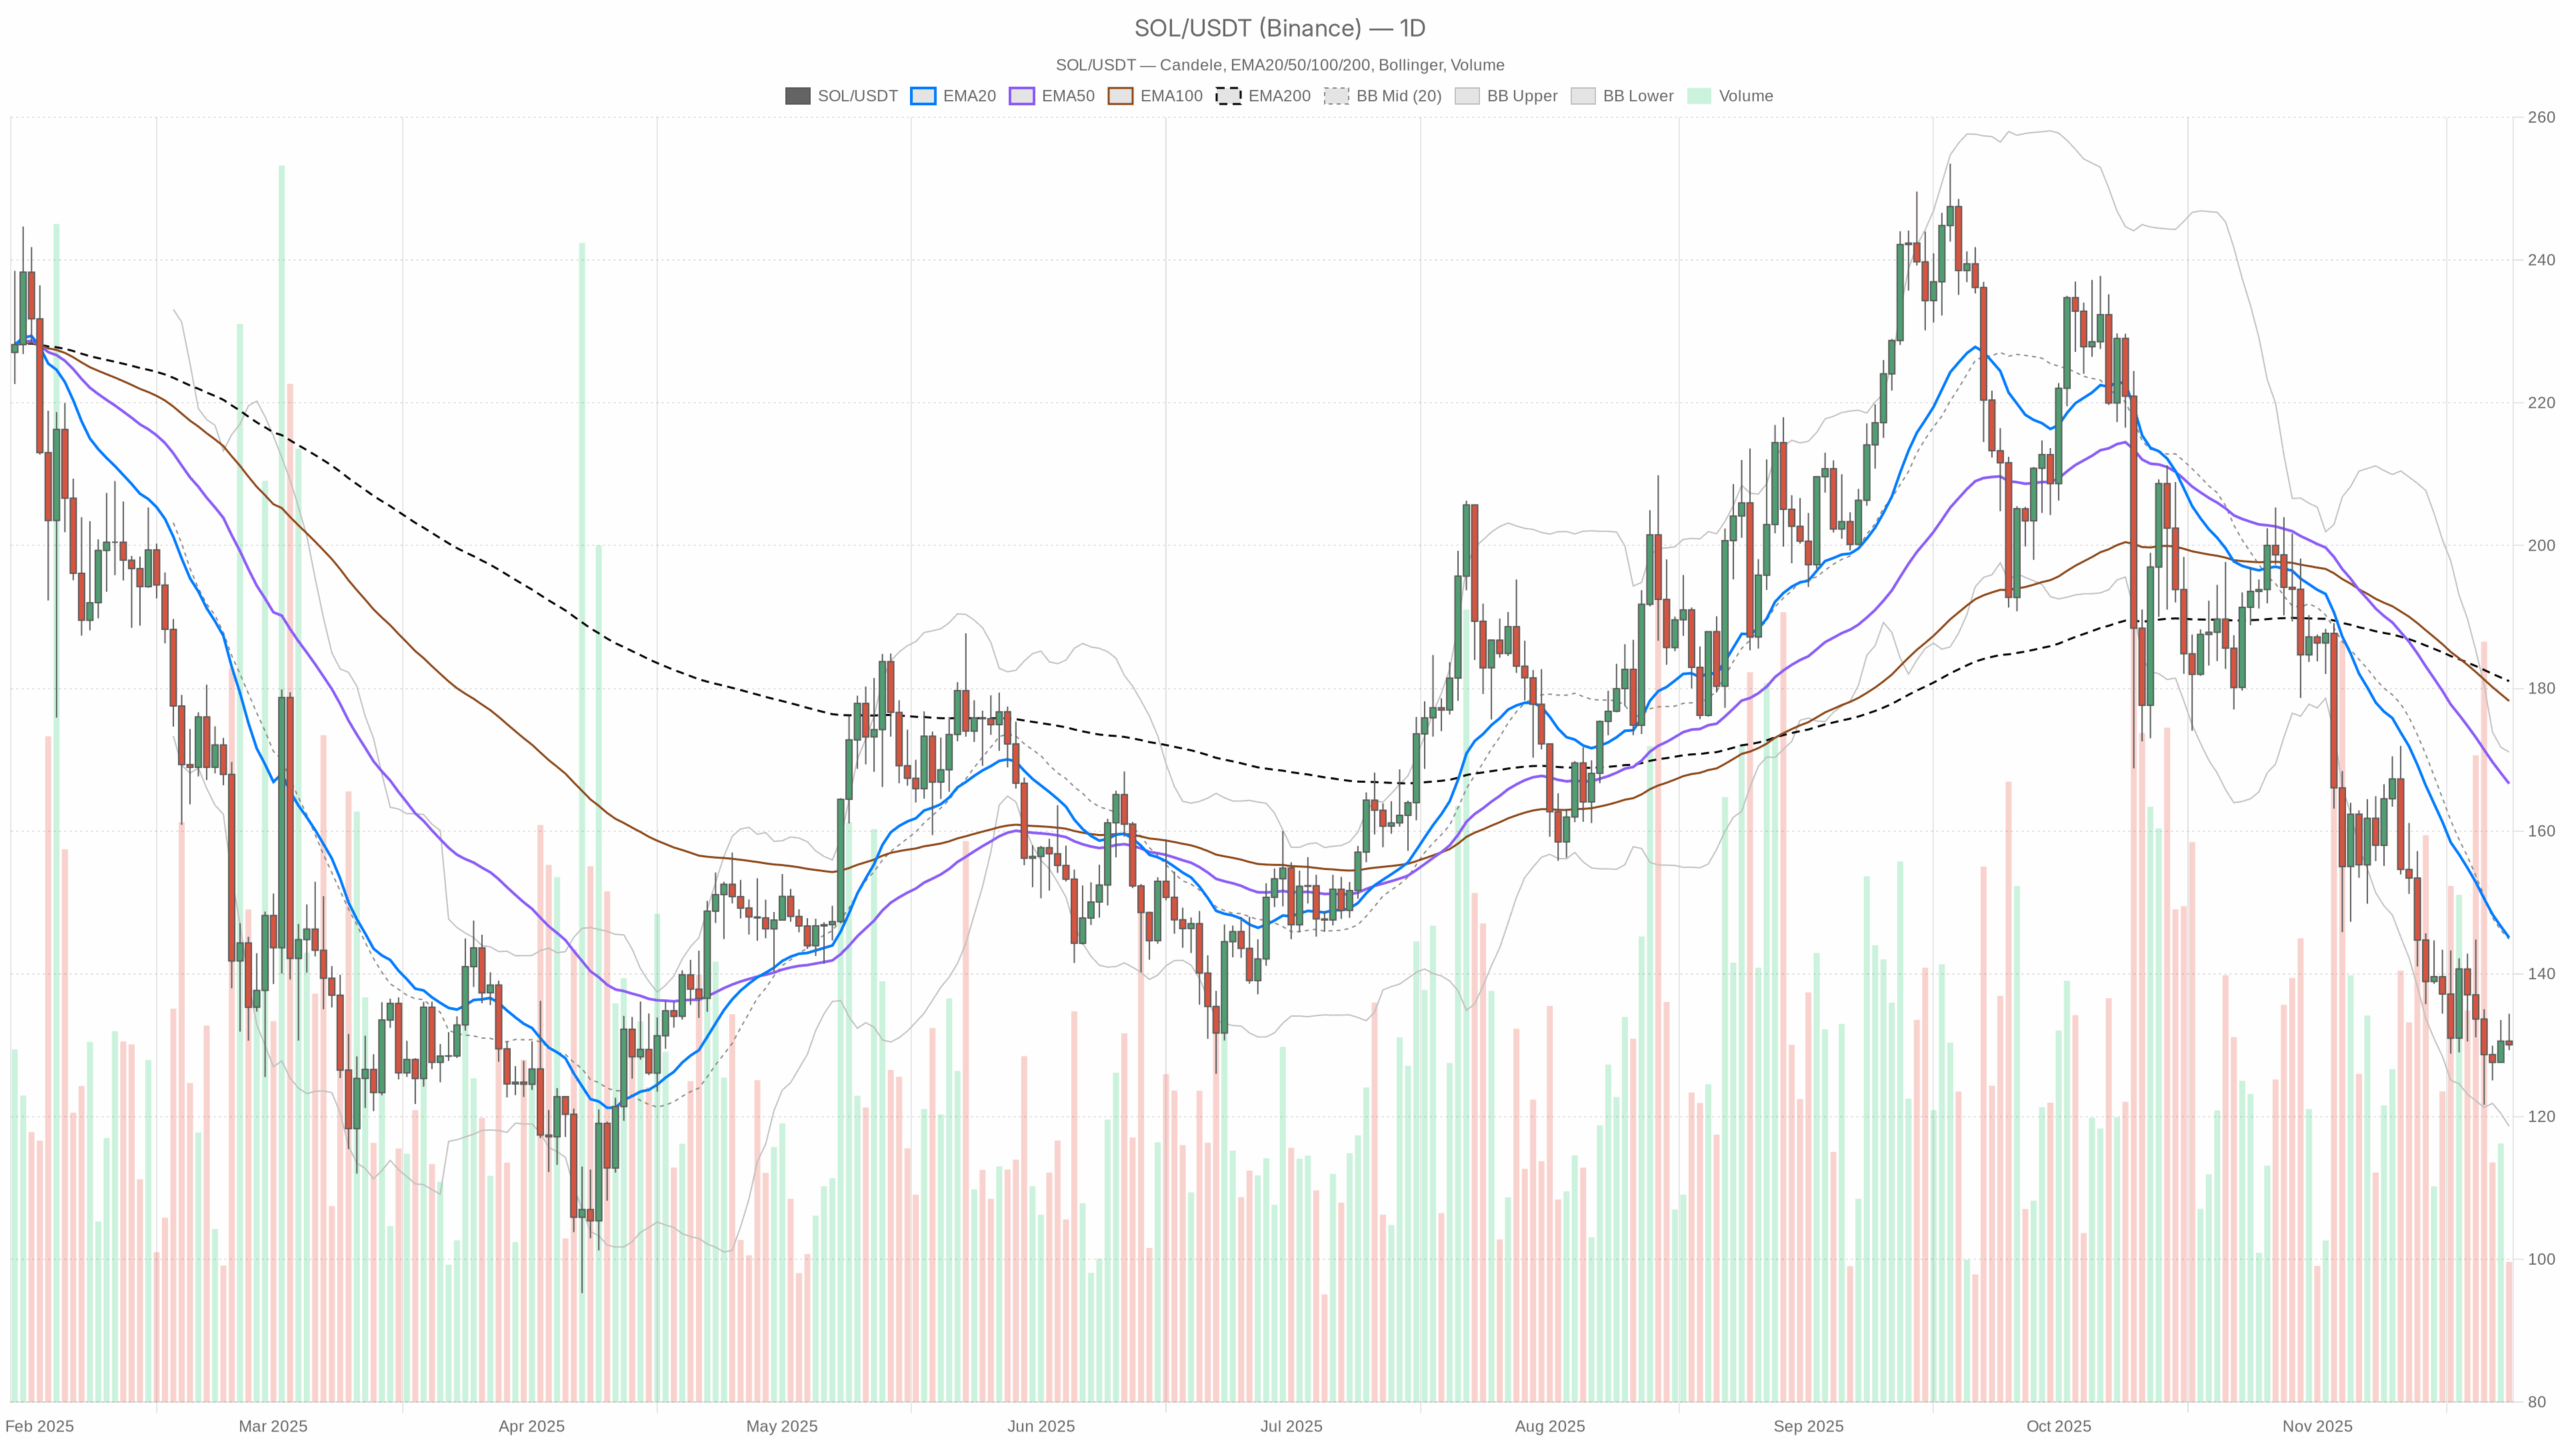 SOL/USDT — daily chart with candlesticks, EMA20/EMA50 and volume.
Summary
The daily chart shows a clear bearish regime, with price around 130 USDT and trading well below the 20, 50 and 200-day EMAs. Momentum is weak, as the daily RSI hovers near 33, close to oversold but not yet washed out. However, the MACD histogram has almost flatlined, suggesting downside momentum is losing strength. Bollinger Bands are wide and price sits in the lower half, pointing to elevated but decelerating volatility. Moreover, the broader crypto market is modestly positive on the day, which contrasts with the token’s underperformance. With the Fear & Greed Index at 19 (Extreme Fear), sentiment is clearly stressed, yet that has historically paved the way for sharp mean-reversion rallies.
Solana crypto forecasting: Market Context and Direction
The backdrop for this move matters. Total crypto market capitalization stands near 3.04 trillion dollars, up about 0.6% over the last 24 hours. That means the broader market is grinding higher even as this asset remains under pressure, a sign of relative weakness versus the aggregate crypto complex. Bitcoin dominance sits just under 57%, confirming that liquidity and risk appetite are still concentrated in the benchmark coin rather than in altcoins.
Moreover, the Fear & Greed Index at 19 signals Extreme Fear. Historically, such readings often coincide with late stages of a selloff, when forced sellers dominate. That said, extreme fear can persist, so it is better seen as a contrarian tailwind rather than a precise timing tool. In contrast to the gloomy sentiment, Solana ecosystem activity remains vibrant: Raydium, Orca, HumidiFi and other Solana-based DeFi venues are still generating substantial fee volumes. This combination of fearful prices and resilient usage hints at an environment where medium-term accumulation may quietly be building, even if the short-term chart looks heavy.
Technical Outlook: reading the overall setup
On the daily timeframe, the token closes near 130.06 USDT. The 20-day EMA around 145.08, the 50-day near 166.65 and the 200-day at 181.01 are all clearly above spot and stacked bearishly (short below long). This configuration confirms a well-established downside trend where rallies so far have been sold rather than bought.
The daily RSI at 32.91 paints a picture of weak momentum but not yet classic capitulation. It implies that sellers remain in control, yet each additional leg lower provides diminishing incremental energy. Meanwhile, the MACD line at -13.57 is slightly above its signal at -13.62, with a marginally positive histogram of 0.05. That tiny cross hints at momentum exhaustion rather than fresh aggressive selling, consistent with a maturing downtrend rather than its early phase.
Bollinger Bands on the daily chart, centered near 144.85 with the lower band around 118.64 and the upper near 171.07, are still relatively wide. Price is trading closer to the lower band, which usually reflects pressure within a volatility expansion following a prior decline. However, the fact that candles are no longer hugging the extreme of the band suggests the move may be shifting from acceleration to consolidation. The ATR at 10.86 confirms that dollar swings remain large; yet when ATR stops rising after a strong drop, it often marks a transition toward a quieter, range-bound environment.
Intraday Perspective and SOLUSDT token Momentum
On the 1-hour chart, the picture is less bearish. Price around 129.97 USDT sits just below the 20-period EMA at 131.34, roughly in line with the 50-period at 130.7, and slightly under the 200-period at 134.91. This clustering of moving averages, combined with a neutral regime tag, suggests short-term consolidation after the previous selloff. As a result, intraday traders are seeing a more balanced tug-of-war between buyers and sellers.
The hourly RSI at 45.25 is neutral, implying that neither side has a clear edge over the very short term. Meanwhile, the hourly MACD line (0.3) is below its signal (0.65) and the histogram is modestly negative, pointing to a mild downside bias rather than a strong push. On the 15-minute chart, RSI dips to about 39.5 and MACD is negative, indicating that fast money remains slightly tilted to the sell side. Nevertheless, both intraday regimes are labeled neutral, reinforcing the idea that the dominant trend is on the daily timeframe, while shorter horizons are trying to stabilize after the fall.
Key Levels and Market Reactions
Daily pivot levels help frame where the next battle could take place. The main pivot point on the daily chart sits around 131.26 USDT, just above current prices. A sustained recovery above that zone would indicate buyers slowly regaining control and might open the door toward the nearby resistance area around 133.2. Conversely, failure to reclaim the pivot and a slip back through the 128 region, aligned with the first daily support, would confirm that sellers still dominate reactions to every bounce.
Bollinger support near 118.64 marks a critical downside reference. A decisive break and daily close below that band would signal a fresh downside breakout with renewed volatility, potentially triggering stop cascades. On the upside, the 20-day EMA near 145 USDT is the first real structural hurdle; if price were to reclaim and hold above that moving average, it would be the earliest sign that the current bearish regime is giving way to a more constructive phase.
Future Scenarios and Investment Outlook
Overall, the base case remains a bearish but aging downtrend on the daily chart, set against a crypto market that is still broadly resilient. Extreme fear, weakening downside momentum on MACD, and neutral intraday structures all argue for a growing probability of a relief rally in the coming sessions. However, as long as price trades beneath the 20-day EMA and fails to establish higher highs above short-term resistance zones, any bounce should be treated as a counter-trend move within a still-fragile structure.
For active traders, that means focusing on reaction areas: keeping an eye on how price behaves around the daily pivot near 131, the support band down toward 118, and the resistance cluster around 145. For longer-term participants, the combination of extreme sentiment and solid underlying network activity suggests that gradual accumulation with strict risk management may offer a balanced approach, acknowledging both the downside risk of a deeper correction and the upside potential if the broader market rotation eventually favors high-beta layer-1 assets again.
This analysis is for informational purposes only and does not constitute financial advice.
Readers should conduct their own research before making investment decisions.
You May Also Like
Stablecoins Are Taking Over TradFi: Inside Ripple’s Massive 2026 Industry Survey

“Trusted the wrong people”—Hawk Tuah Denies Role in HAWK Token Collapse