Aster price is trading at a crucial support zone with multiple technical confluences aligning, hinting that a bullish Elliott Wave structure may be forming.Aster price is trading at a crucial support zone with multiple technical confluences aligning, hinting that a bullish Elliott Wave structure may be forming.

Aster price hints at bullish Elliott Wave structure: Bottom developing?

Aster price is trading at a crucial support zone with multiple technical confluences aligning, hinting that a bullish Elliott Wave structure may be forming if the level continues to hold.

Summary
  • Market sentiment toward Aster is improving as selling pressure slows across multiple time frames
  • Recent volume behavior reflects growing interest around current lows, supporting a potential shift in momentum
  • Broader altcoin market recovery could provide additional support for Aster’s next move

Aster’s (ASTER) recent price action is beginning to show the early signs of a potential Elliott Wave expansion as the asset trades directly on a central multi-confluence support zone.

With momentum stabilizing and structure shifting after a strong reaction from the value area low, market conditions may now be constructing the foundation for a bullish breakout sequence, especially as on-chain data recently refuted the $35M ASTER transfer allegation linked to Changpeng Zhao, helping ease speculation around the project.

Aster price key technical points

  • Aster is holding a critical support cluster formed by the 0.618 Fibonacci, point of control, and daily HTF support
  • Initial structure break signals a potential transition into a Wave 3 expansion
  • A higher low at the current support may trigger a rally toward $2.30 resistance
Aster price hints at bullish Elliott Wave structure: Bottom developing? - 1

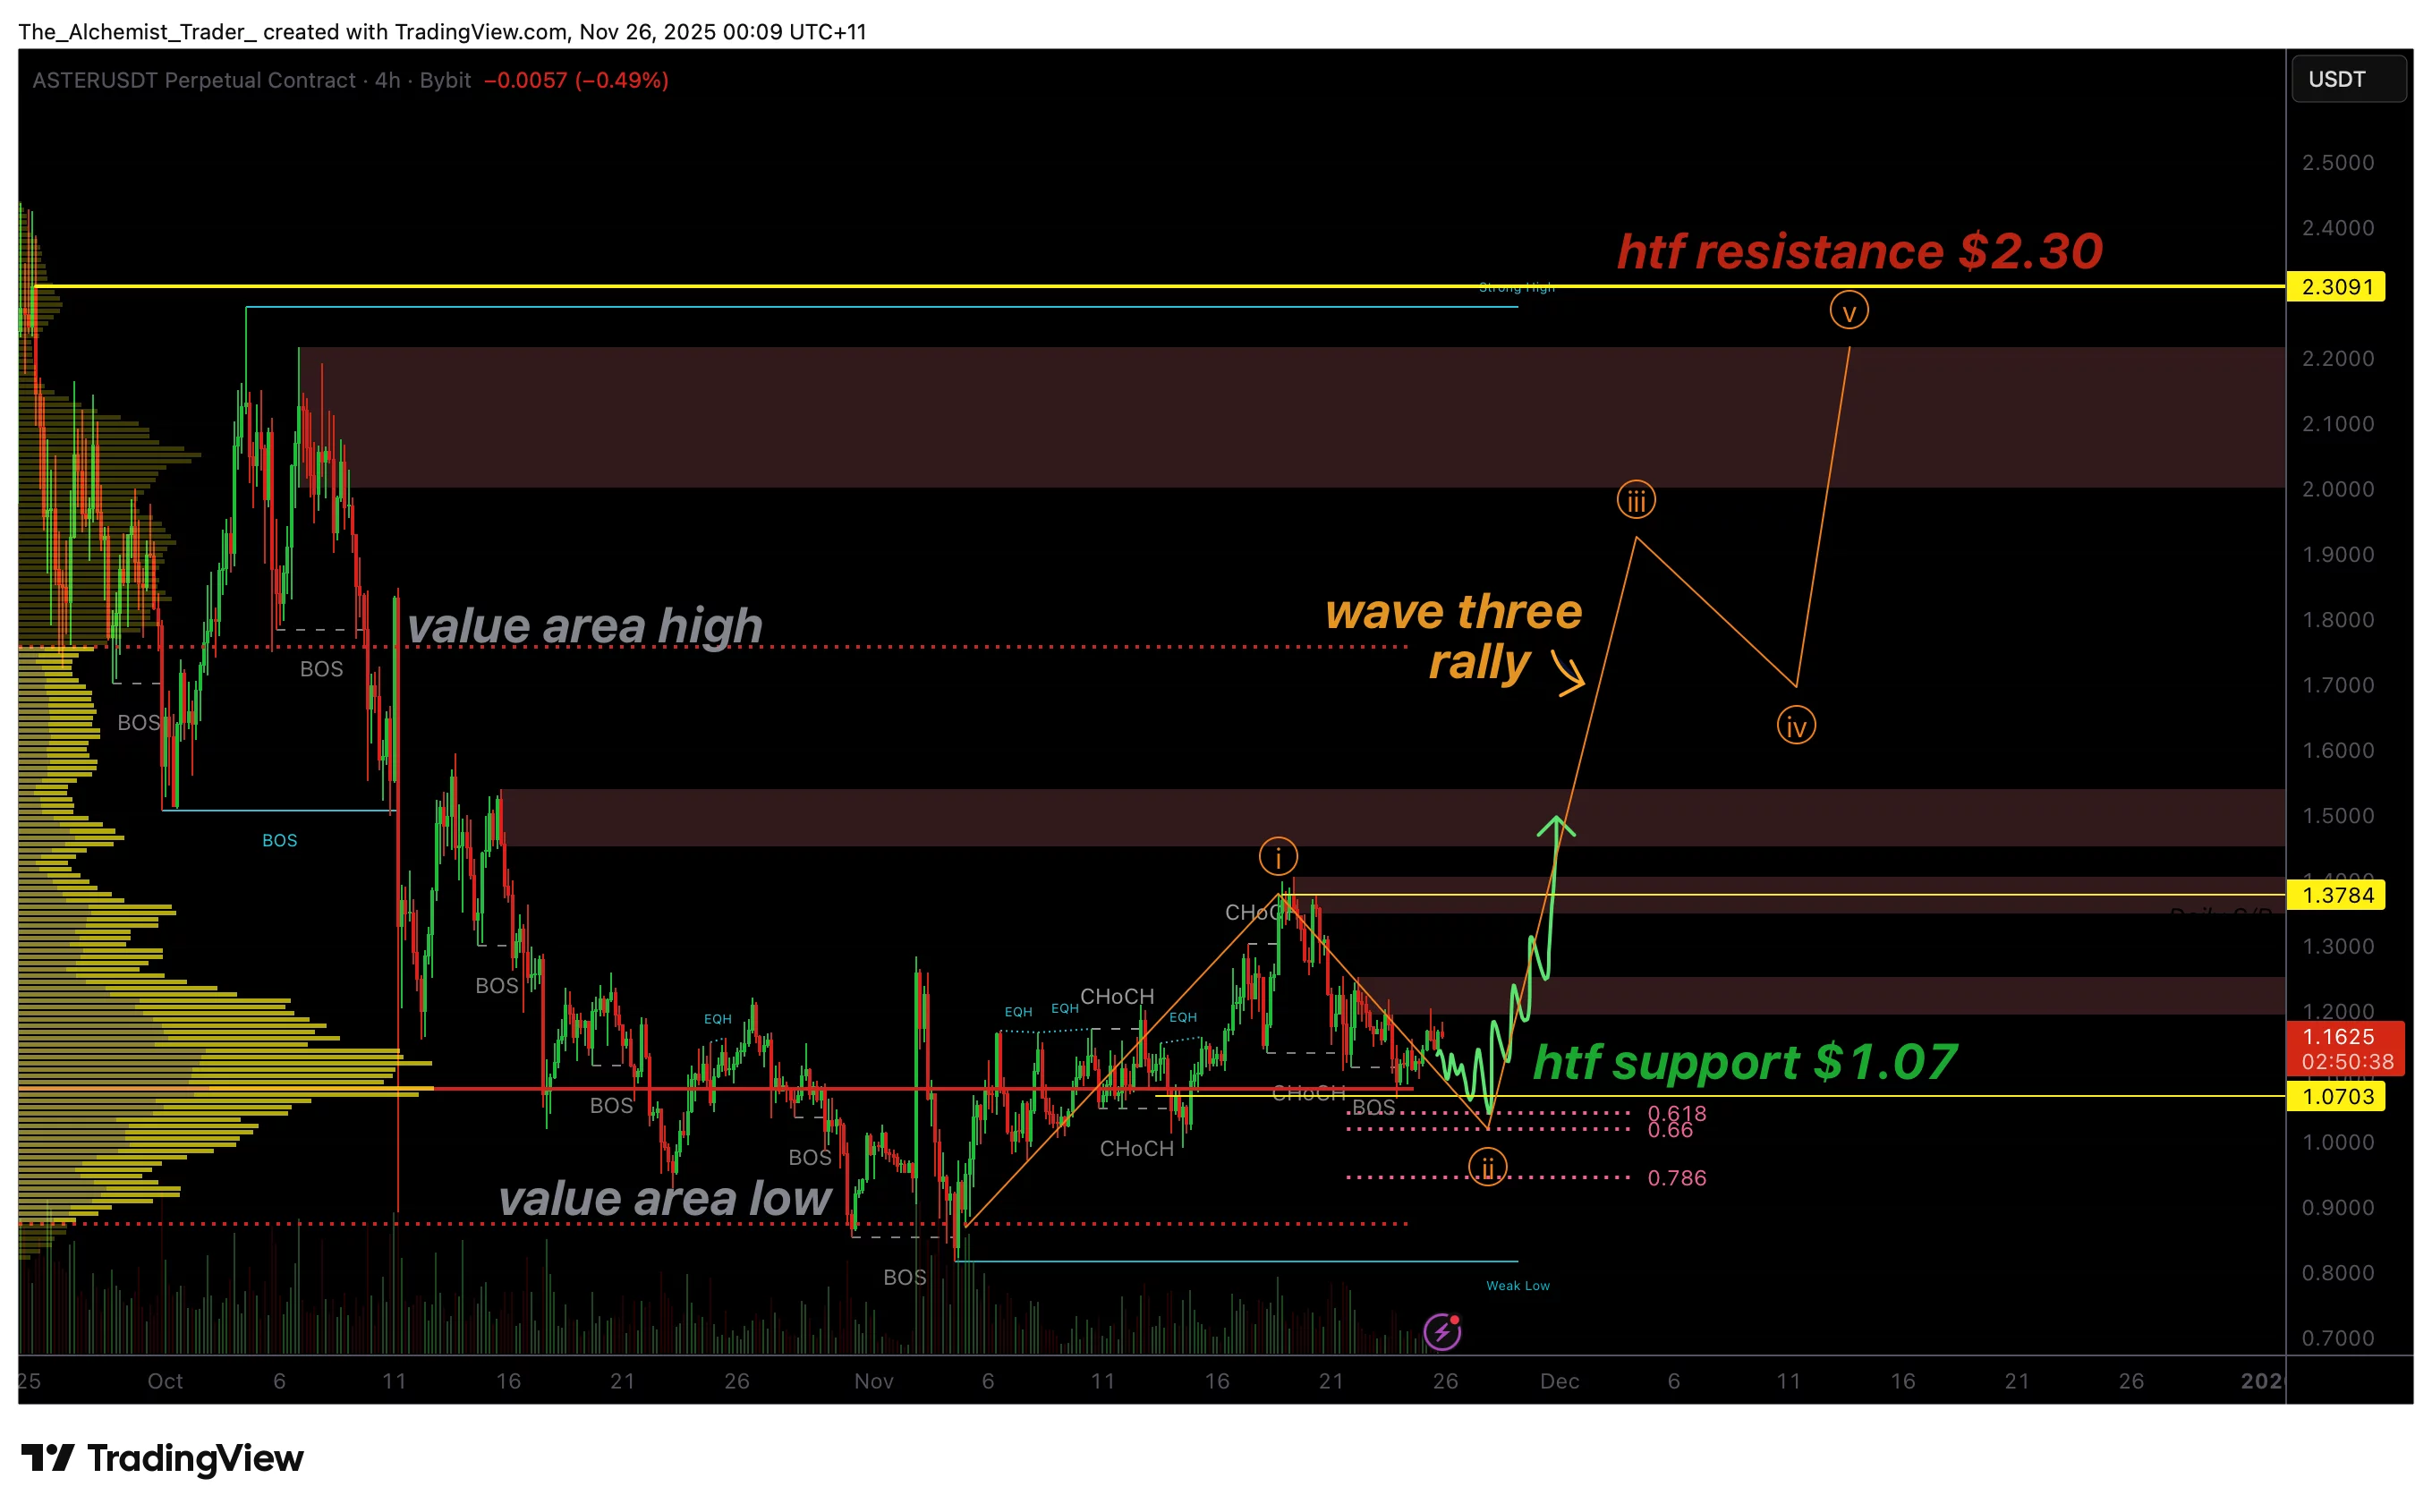
Aster is showing early indications that a bullish Elliott Wave structure may be forming. The asset is currently positioned on a high-value support zone that aligns the 0.618 Fibonacci retracement, the point of control, and a major daily timeframe support level. Historically, these types of multi-layered confluence zones have marked significant pivots for Aster, providing strong bases for expansion phases.

The first indication of a structural shift occurred when price bounced sharply from the value area low and proceeded to break the immediate market structure, forming a new swing high. This is a classic signal seen at the beginning of an Elliott Wave transition.

For this pattern to continue validating, Aster now needs to establish a higher low in the current support range. Doing so would solidify the Wave 2 retracement and set the stage for a potential Wave 3 push.

Wave 3 expansions are typically the strongest and most impulsive in the Elliott Wave cycle, and in Aster’s case, such a move would target the value area high and extend toward the key high-time-frame resistance at $2.30. This region has historically acted as a primary reaction area and would be the first significant upside objective if the structure continues to unfold.

So from a technical perspective, Aster is sitting at one of its most critical structural levels. If the asset can maintain strength above this zone and confirm a higher low, it would support the idea that a bullish Elliott Wave expansion is underway, especially as some observers note that Aster’s recent spotlight may reflect how influential reputations like Changpeng Zhao’s continue to shape market visibility.

What to expect in the coming price action

If the current support holds and a higher low forms, Aster could initiate a Wave 3-style breakout toward $2.30. Losing this support, however, would invalidate the structure and delay any bullish continuation.

Market Opportunity
Aster Logo
Aster Price(ASTER)
$0.6303
$0.6303$0.6303
-11.71%
USD
Aster (ASTER) Live Price Chart
Disclaimer: The articles reposted on this site are sourced from public platforms and are provided for informational purposes only. They do not necessarily reflect the views of MEXC. All rights remain with the original authors. If you believe any content infringes on third-party rights, please contact service@support.mexc.com for removal. MEXC makes no guarantees regarding the accuracy, completeness, or timeliness of the content and is not responsible for any actions taken based on the information provided. The content does not constitute financial, legal, or other professional advice, nor should it be considered a recommendation or endorsement by MEXC.

You May Also Like

Is Doge Losing Steam As Traders Choose Pepeto For The Best Crypto Investment?

Is Doge Losing Steam As Traders Choose Pepeto For The Best Crypto Investment?

The post Is Doge Losing Steam As Traders Choose Pepeto For The Best Crypto Investment? appeared on BitcoinEthereumNews.com. Crypto News 17 September 2025 | 17:39 Is dogecoin really fading? As traders hunt the best crypto to buy now and weigh 2025 picks, Dogecoin (DOGE) still owns the meme coin spotlight, yet upside looks capped, today’s Dogecoin price prediction says as much. Attention is shifting to projects that blend culture with real on-chain tools. Buyers searching “best crypto to buy now” want shipped products, audits, and transparent tokenomics. That frames the true matchup: dogecoin vs. Pepeto. Enter Pepeto (PEPETO), an Ethereum-based memecoin with working rails: PepetoSwap, a zero-fee DEX, plus Pepeto Bridge for smooth cross-chain moves. By fusing story with tools people can use now, and speaking directly to crypto presale 2025 demand, Pepeto puts utility, clarity, and distribution in front. In a market where legacy meme coin leaders risk drifting on sentiment, Pepeto’s execution gives it a real seat in the “best crypto to buy now” debate. First, a quick look at why dogecoin may be losing altitude. Dogecoin Price Prediction: Is Doge Really Fading? Remember when dogecoin made crypto feel simple? In 2013, DOGE turned a meme into money and a loose forum into a movement. A decade on, the nonstop momentum has cooled; the backdrop is different, and the market is far more selective. With DOGE circling ~$0.268, the tape reads bearish-to-neutral for the next few weeks: hold the $0.26 shelf on daily closes and expect choppy range-trading toward $0.29–$0.30 where rallies keep stalling; lose $0.26 decisively and momentum often bleeds into $0.245 with risk of a deeper probe toward $0.22–$0.21; reclaim $0.30 on a clean daily close and the downside bias is likely neutralized, opening room for a squeeze into the low-$0.30s. Source: CoinMarketcap / TradingView Beyond the dogecoin price prediction, DOGE still centers on payments and lacks native smart contracts; ZK-proof verification is proposed,…
Share
BitcoinEthereumNews2025/09/18 00:14
Vitalik Buterin Supports Native Rollup Integration on Ethereum

Vitalik Buterin Supports Native Rollup Integration on Ethereum

The post Vitalik Buterin Supports Native Rollup Integration on Ethereum appeared on BitcoinEthereumNews.com. Key Points: Vitalik Buterin supports ZK Rollups for
Share
BitcoinEthereumNews2026/01/19 15:43
NEAR Price Prediction: Testing Critical $1.88 Resistance with $2.10-$2.35 Targets by February 2026

NEAR Price Prediction: Testing Critical $1.88 Resistance with $2.10-$2.35 Targets by February 2026

The post NEAR Price Prediction: Testing Critical $1.88 Resistance with $2.10-$2.35 Targets by February 2026 appeared on BitcoinEthereumNews.com. Rebeca Moen
Share
BitcoinEthereumNews2026/01/19 15:34