Bitcoin Price Rebound Picks Up Pace With $90K Break in Focus
Bitcoin price started a recovery wave above $88,000. BTC is now consolidating and might soon aim for a move above the $90,000 zone.
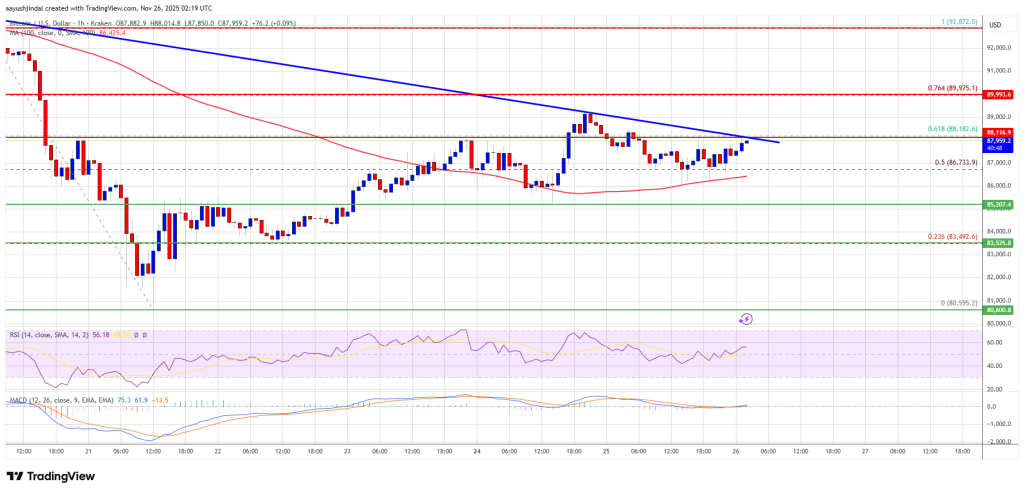
- Bitcoin started a recovery wave and climbed toward $89,000.
- The price is trading above $87,000 and the 100 hourly Simple moving average.
- There is a bearish trend line forming with resistance at $88,200 on the hourly chart of the BTC/USD pair (data feed from Kraken).
- The pair might continue to move up if it settles above the $90,000 zone.
Bitcoin Price Eyes Upside Break
Bitcoin price managed to stay above the $83,500 level. BTC formed a base and recently started a recovery wave above the $85,500 resistance zone.
There was a move above the $86,000 resistance zone. The bulls pushed the price above the 50% Fib retracement level of the downward move from the $92,872 swing high to the $80,595 low. However, the bears are currently preventing an upside break above the $90,000 zone.
Besides, there is a bearish trend line forming with resistance at $88,200 on the hourly chart of the BTC/USD pair. Bitcoin is now trading above $87,000 and the 100 hourly Simple moving average.
If the bulls attempt another recovery wave, the price could face resistance near the $88,200 level. The first key resistance is near the $89,000 level. The next resistance could be $90,000 or the 76.4% Fib retracement level of the downward move from the $92,872 swing high to the $80,595 low.
A close above the $90,000 resistance might send the price further higher. In the stated case, the price could rise and test the $91,750 resistance. Any more gains might send the price toward the $92,500 level. The next barrier for the bulls could be $93,500 and $94,000.
Another Drop In BTC?
If Bitcoin fails to rise above the $90,000 resistance zone, it could start another decline. Immediate support is near the $86,700 level. The first major support is near the $86,200 level.
The next support is now near the $85,000 zone. Any more losses might send the price toward the $83,500 support in the near term. The main support sits at $82,000, below which BTC might accelerate lower in the near term.
Technical indicators:
Hourly MACD – The MACD is now gaining pace in the bullish zone.
Hourly RSI (Relative Strength Index) – The RSI for BTC/USD is now above the 50 level.
Major Support Levels – $86,200, followed by $85,000.
Major Resistance Levels – $89,000 and $90,000.


You May Also Like

👨🏿🚀TechCabal Daily – OPay eyes US IPO

Virtual Asset Taxation: Key South Korean Lawmaker Pushes for 2027 Start as Planned