

XRP Price Pauses Upside Momentum While BTC and ETH Accelerate Their Recovery
XRP price started a steady increase above $2.20. The price is now consolidating gains and might aim for another increase if it clears $2.280.
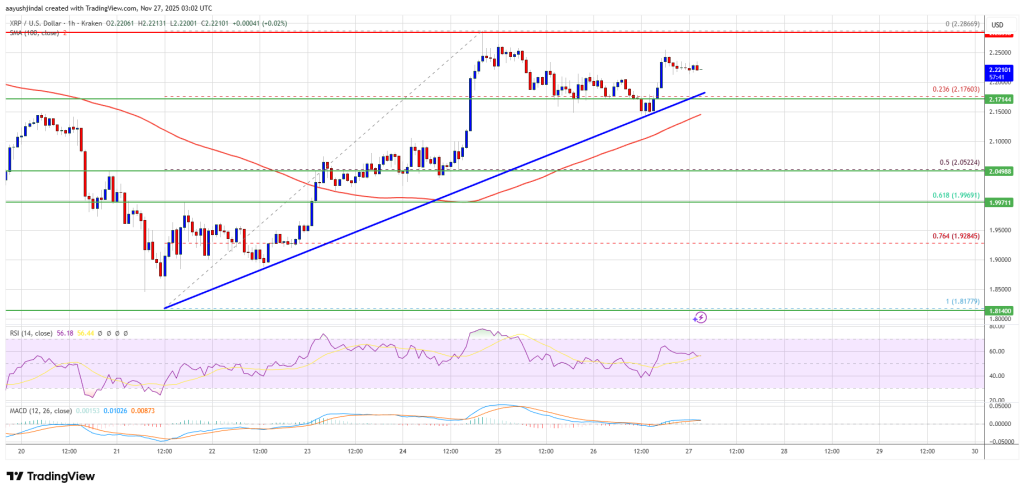
- XRP price started a fresh increase above the $2.220 zone.
- The price is now trading above $2.20 and the 100-hourly Simple Moving Average.
- There is a bullish trend line forming with support at $2.180 on the hourly chart of the XRP/USD pair (data source from Kraken).
- The pair could continue to move up if it clears $2.280.
XRP Price Holds Ground
XRP price started a decent upward move above $2.10 and $2.120, beating Bitcoin and Ethereum. The price gained pace for a clear move above the $2.20 resistance.
The bulls even pumped the price above the $2.220 zone. A high was formed at $2.286 and the price started a short-term downside correction, but ETH and BTC rallied. There was a move below the 23.6% Fib retracement level of the upward move from the $1.817 swing low to the $2.286 high.
The price is now trading above $2.20 and the 100-hourly Simple Moving Average. Besides, there is a bullish trend line forming with support at $2.180 on the hourly chart of the XRP/USD pair.
If there is a fresh upward move, the price might face resistance near the $2.2650 level. The first major resistance is near the $2.280 level, above which the price could rise and test $2.350. A clear move above the $2.350 resistance might send the price toward the $2.450 resistance. Any more gains might send the price toward the $2.50 resistance. The next major hurdle for the bulls might be near $2.550.
Another Pullback?
If XRP fails to clear the $2.280 resistance zone, it could start a fresh decline. Initial support on the downside is near the $2.180 level and the trend line. The next major support is near the $2.120 level.
If there is a downside break and a close below the $2.120 level, the price might continue to decline toward $2.050 and the 50% Fib retracement level of the upward move from the $1.817 swing low to the $2.286 high. The next major support sits near the $2.00 zone, below which the price could continue lower toward $1.9250.
Technical Indicators
Hourly MACD – The MACD for XRP/USD is now losing pace in the bullish zone.
Hourly RSI (Relative Strength Index) – The RSI for XRP/USD is now above the 50 level.
Major Support Levels – $2.180 and $2.050.
Major Resistance Levels – $2.280 and $2.350.
You May Also Like

Supported by hike speculation and PMIs – Danske Bank

The geopolitics of anti-corruption as global advisory firms face debarment in the Horn of Africa

BitGo wins BaFIN nod to offer regulated crypto trading in Europe
BitGo’s move creates further competition in a burgeoning European crypto market that is expected to generate $26 billion revenue this year, according to one estimate. BitGo, a digital asset infrastructure company with more than $100 billion in assets under custody, has received an extension of its license from Germany’s Federal Financial Supervisory Authority (BaFin), enabling it to offer crypto services to European investors. The company said its local subsidiary, BitGo Europe, can now provide custody, staking, transfer, and trading services. Institutional clients will also have access to an over-the-counter (OTC) trading desk and multiple liquidity venues.The extension builds on BitGo’s previous Markets-in-Crypto-Assets (MiCA) license, also issued by BaFIN, and adds trading to the existing custody, transfer and staking services. BitGo acquired its initial MiCA license in May 2025, which allowed it to offer certain services to traditional institutions and crypto native companies in the European Union.Read more
