Bitcoin Puell Multiple Plunges, But Not Inside Bottom Zone Yet
On-chain data shows the Bitcoin Puell Multiple has gone through a decline recently, a sign that miner revenue has gone down relative to its baseline.
Bitcoin Puell Multiple Has Dropped To 0.67
In a new post on X, analyst Ali Martinez has talked about the latest trend in the Bitcoin Puell Multiple. The “Puell Multiple” refers to a popular on-chain indicator that keeps track of the ratio between the daily BTC mining revenue (in USD) and 365-day moving average (MA) of the same.
Miners earn their income through two sources: block subsidy and transaction fees. In the context of the metric, however, only the former part of their revenue is relevant.
Block subsidy is a fixed BTC-denominated reward that miners receive when they add the next block to the chain. Usually, it makes up for the dominant and stable part of miner income.
When the value of the Puell Multiple is greater than 1, it means that the network validators are earning a higher revenue from block subsidy than the average for the past year. On the other hand, the metric being under the mark implies miners are making less than usual.
Now, here is the chart shared by Martinez that shows the trend in the Bitcoin Puell Multiple over the past decade:
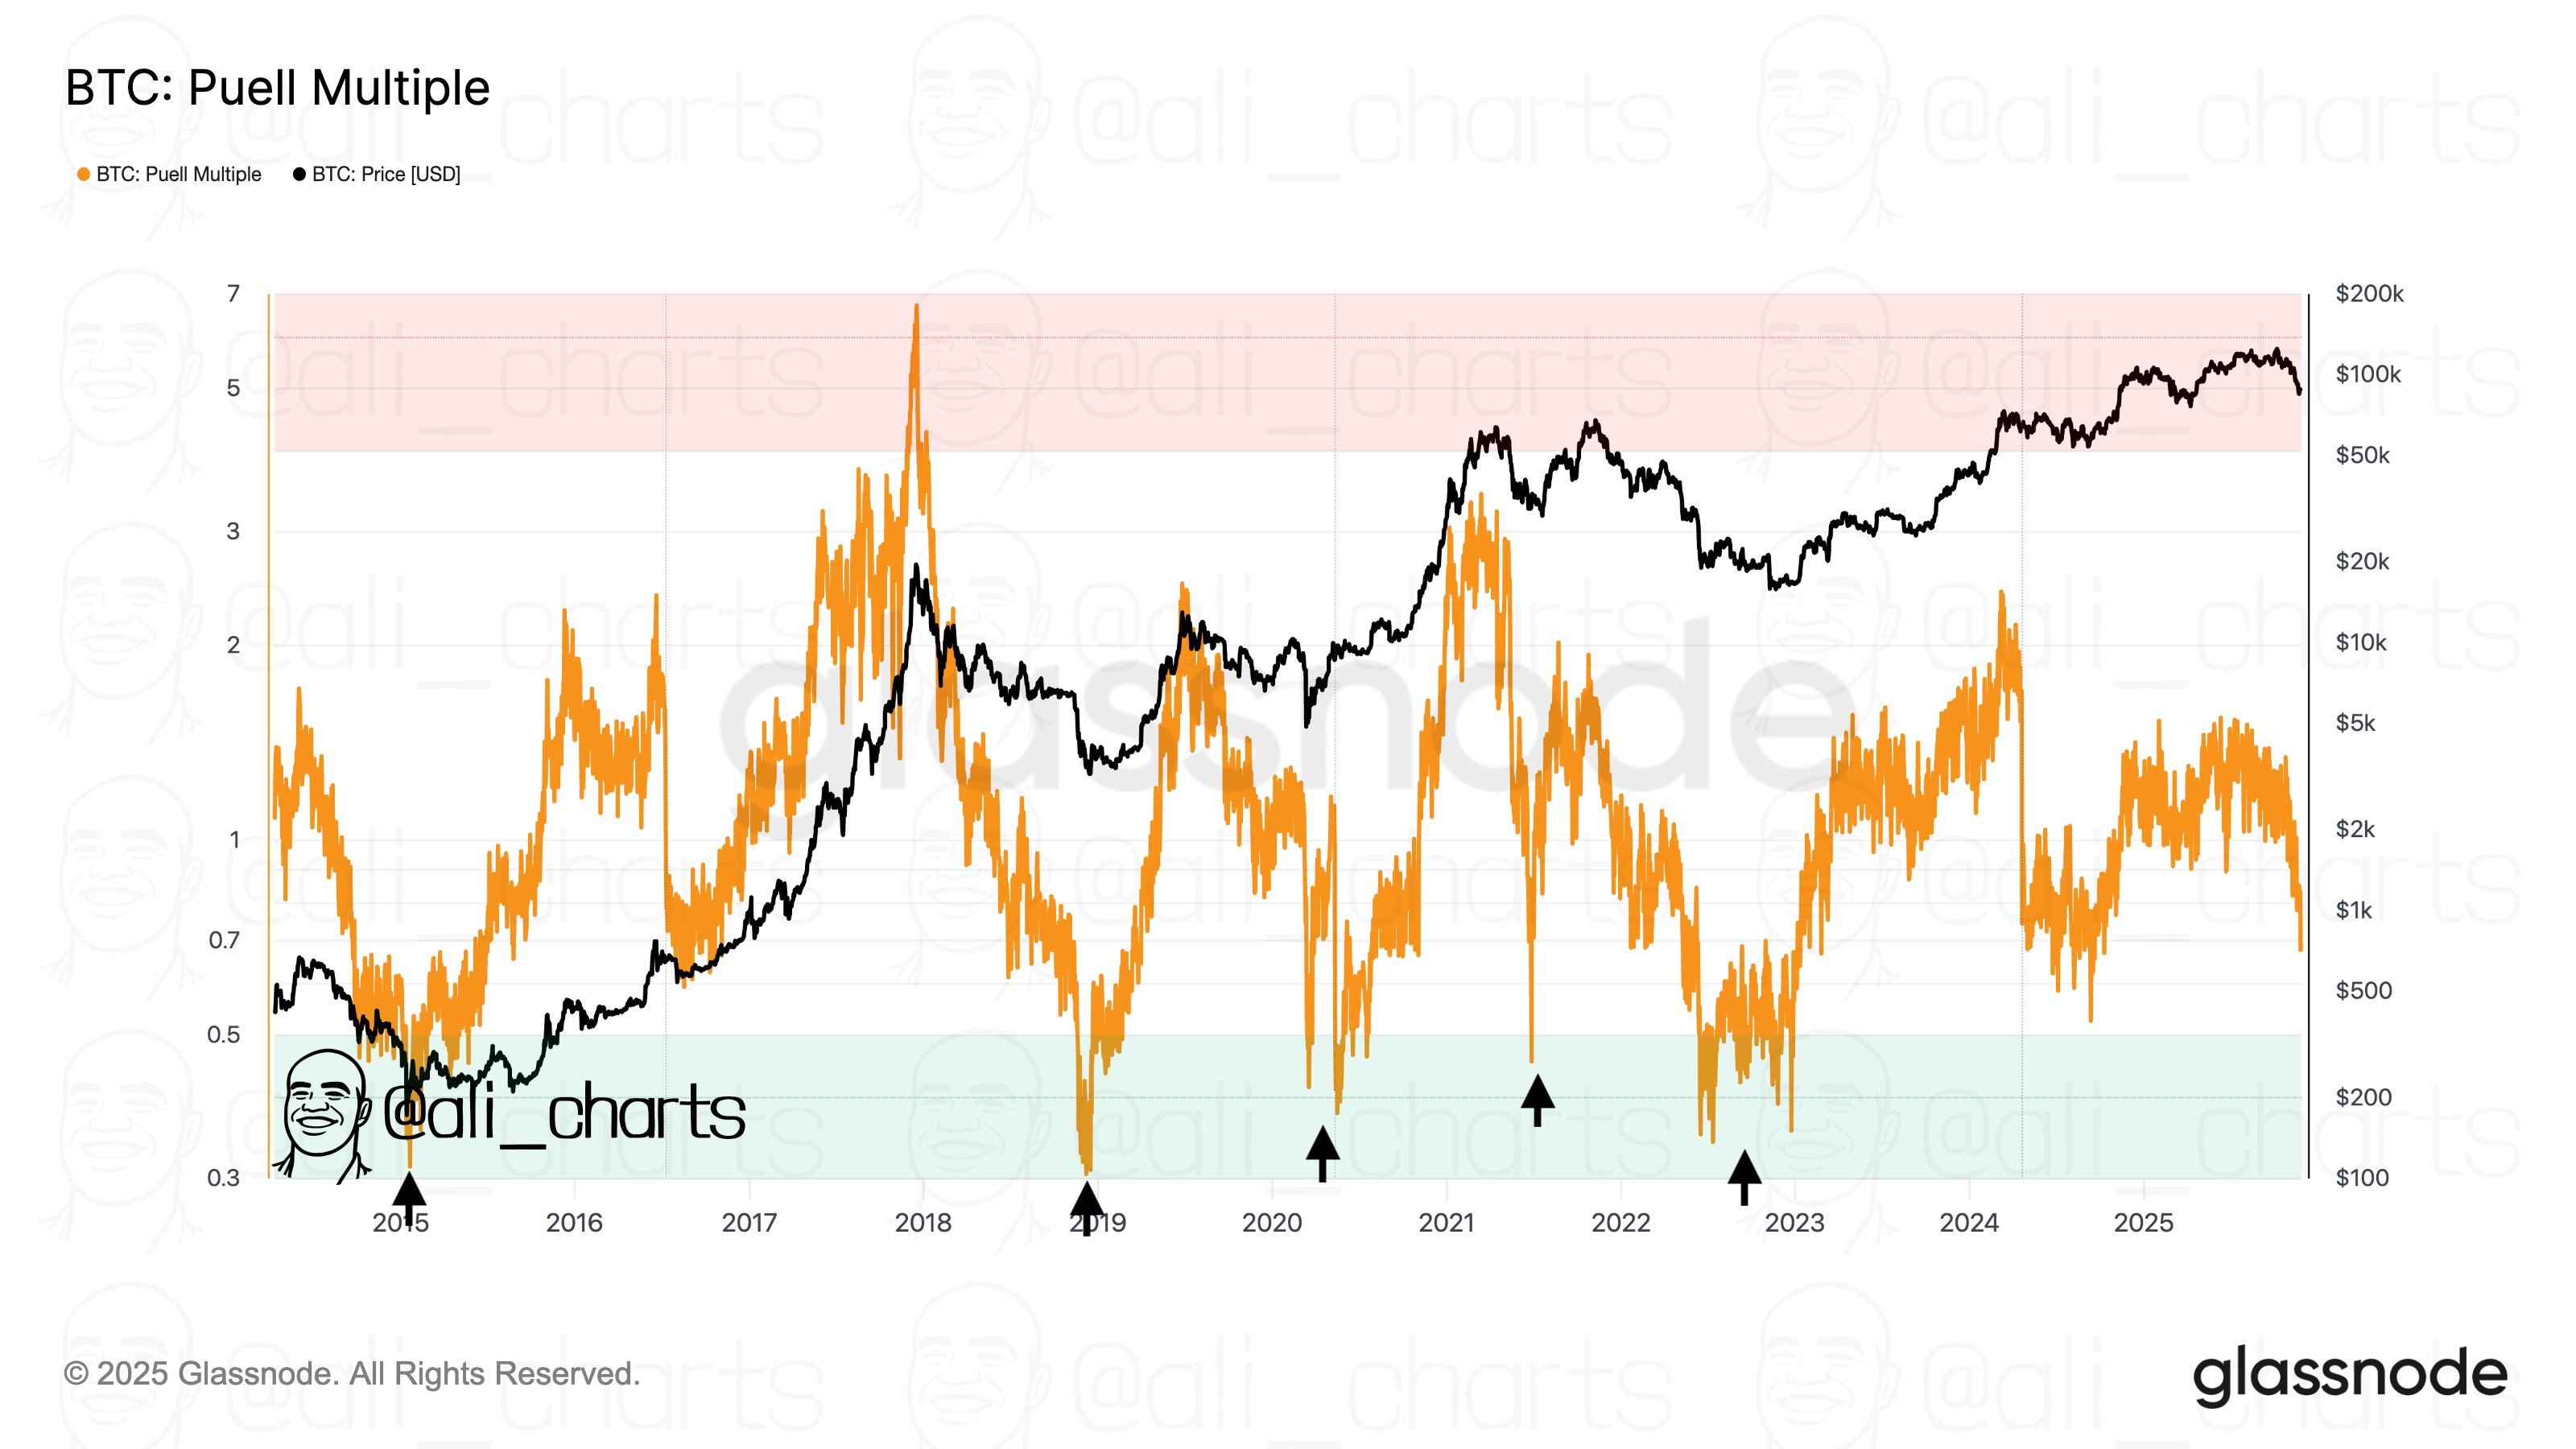
As displayed in the above graph, the Bitcoin Puell Multiple has witnessed a rapid decline recently that has taken its value below the 1 level. This drop in the metric is a result of the bearish price action that the cryptocurrency has faced.
The block subsidy is fixed in BTC value and is more-or-less also fixed in rate of time, so the daily BTC income from it is about constant for miners. The USD value of the reward, however, is dependent on the asset’s spot price, which is indeed variable.
The earlier bull run resulted in the Puell Multiple rising above the 1 mark as miner revenue from block subsidy surged. Similarly, the market downturn has led to a decline in the USD miner income.
Today, the metric’s value is 0.67, meaning that the chain validators are making just 67% of the average revenue from the last 365 days. Historically, miners being under a high amount of pressure has made bottoms more probable for Bitcoin.
As the analyst has highlighted in the chart, the major bottoms since 2015 have generally formed when the Puell Multiple has dipped below 0.50. If the current cycle is also going to follow a similar pattern, then miner pain may not be enough for a bottom yet.
BTC Price
The latest rebound in the Bitcoin price has sustained for now as its price is still trading around $91,600.
You May Also Like

TCL Discounts NXTPAPER Tablets and Budget Devices on Amazon

Trump pays french company $1 billion to cut wind energy just in time for energy crisis