

Bitcoin’s November Slump Could Trigger A 2026 Revival, Analysts Say
Bitcoin dropped sharply this month and is set to post one of its worst Novembers in years, leaving traders and fund managers weighing whether to buy or hold fire.
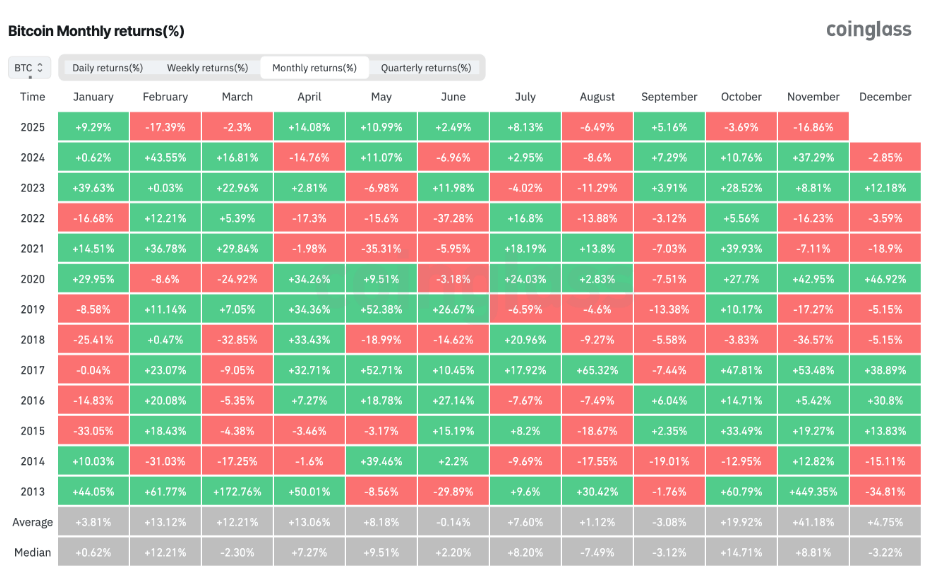
Based on reports, the token is down about 18% for November and was trading below $91,000 as markets quieted heading into the weekend.
Market Cleansing Opens The Door For Buyers
According to CoinGlass, this decline approaches the scale of losses seen in November 2019, when Bitcoin fell roughly 17%, and is far from the harsh 35% crash of November 2018.
Reports have disclosed that some analysts view the drop as a market reset. Nick Ruck, research director at LVRG, said overleveraged positions and weak projects have been mostly cleared out, which could let longer-term holders add exposure at lower prices.
Technical Levels Take Center Stage
Traders are watching a pair of monthly-close levels closely. An analyst using the handle CrediBull Crypto identified $93,400 and $102,400 as the two most relevant thresholds.
A close above $93,000 would be interpreted as a modest positive sign, the analyst said, while any monthly finish above $102,000 would be read as very bullish — though that may not happen until another month.
Bitcoin changed hands around $91,450 in midweek trade, failing to break a resistance just under $92,000.
Cycle Changes And Institutional FlowsBased on reports from industry sources, some market watchers think the rhythm of rallies has shifted since the arrival of spot Bitcoin ETFs in early 2024.
According to some analysts, institutional participation has altered the timing and breadth of moves. That has meant gains that once clustered at year-end can show up earlier.
Market experts pointed out that November is usually a strong month for Bitcoin, and that a red November has often been followed by a red December in past years.
A Stalemate Between Bulls And BearsMatrixport described the market as a rare zone of impasse where sentiment, positioning and macro cues are all converging. Reports noted that Bitcoin rebounded above $91.8K during Thanksgiving, but the move did little to resolve the split between bullish and bearish expectations.
Liquidity has thinned, volatility has dropped, and requests for crash protection have faded. Glassnode added that realized losses have risen and futures markets are deleveraging, signs that short-term conviction is weak. That mix leaves the market stuck between a push toward $100K and a slide down to $80K.
Signs Point To A Big Move, Direction UnknownA bullish hammer reversal emerged when Bitcoin briefly touched the $80K area, giving some traders hope of a rally into the holiday season.
Others say weak demand and thin liquidity could push prices lower before confidence returns. In either case, markets have been quietly positioning for a larger directional move, even if nobody can say for sure which way that move will go.
For now, Bitcoin sits in a cautious in-between. Investors and traders will be watching the monthly close, liquidity measures and options flows for clues.
The next clear signal could decide whether late buyers get rewarded — or whether sellers set a new range.
Featured image from Gemini, chart from TradingView


You May Also Like

$45 Million in Crypto Fraud Mapped as Operation Atlantic Identifies Victims Across US, UK, Canada – Bitcoin News

NZD/USD holds losses near 0.5850 on mixed Chinese data, US CPI looms


