

Ethereum (ETH) Price Slides; Mirrors 2017 & 2020 Patterns—Is a Breakout Ahead?
The post Ethereum (ETH) Price Slides; Mirrors 2017 & 2020 Patterns—Is a Breakout Ahead? appeared first on Coinpedia Fintech News
Following the Bitcoin price plunge below the crucial support at $84,000, driven by bid-side liquidity collapse, the crypto markets have shaken. The ripple effects spread to other altcoins such as Ethereum and Solana, whose prices fell more than Bitcoin’s. ETH price slipped sharply this week, falling back toward the mid-$2,700 range as broader crypto market volatility pushed investors into risk-off mode. While the short-term technicals look fragile, deeper analysis of staking flows, historical price structure, and long-term accumulation zones suggests the latest decline may be less about weakness and more about opportunity for long-horizon players.
ETH Returns to Its ‘Discount Zone’—A Level Where Major Rallies Historically Begin
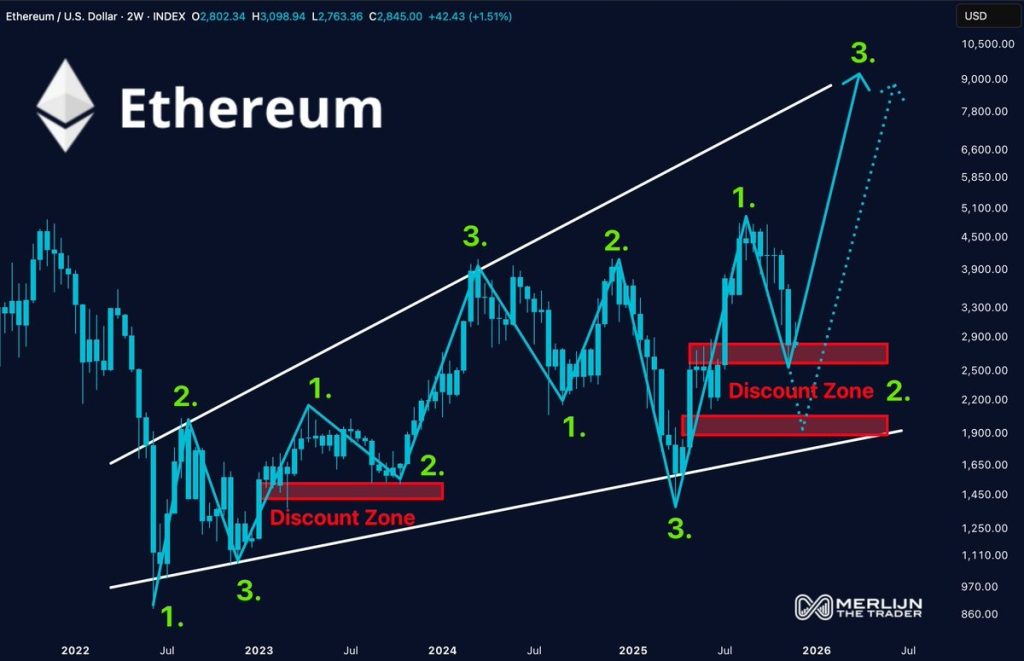
Ethereum has re-entered a major multi-year “discount zone”—a price region that has consistently acted as a long-term accumulation range. The chart shows the ETH price still moving inside an ascending parallel channel that dates back to early 2022.
 Source: X
Previous dips into this lower band (late-2022, mid-2023, and early-2025) all triggered strong rallies, often marking the beginning of multi-month uptrends. The current return to the discount zone mirrors those earlier setups, suggesting the downside may be more limited than the recent market sentiment implies.
This structural trend remains intact despite the pullback, offering a key insight: ETH’s macro uptrend is unbroken.
Whales Are Staking More ETH — Even During the Correction
While spot price weakness might suggest fading confidence, on-chain data shows the opposite. Large validators—typically whales or institutions—continue sending repeated batches of 32 ETH to the Ethereum Deposit Contract.
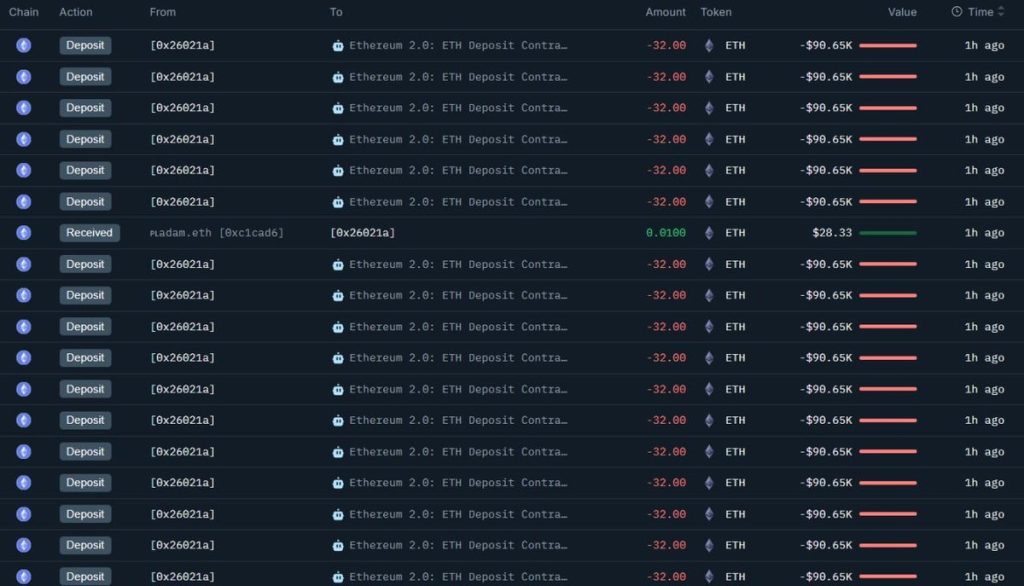
The above data suggest an early Ethereum whale just staked 40,000 ETH worth $120 million after 10 years of inactivity. This behavior indicates sustained accumulation and long-term commitment. When whales increase staking during market drawdowns, it often signals they see the move as temporary, not structural.
Historically, aggressive staking inflows have aligned with major cycle expansions, as they reduce liquid supply and tighten exchange reserves. The pattern appears to be repeating.
Ethereum’s Current Structure Mirrors the 2017 and 2020 Accumulation Phases
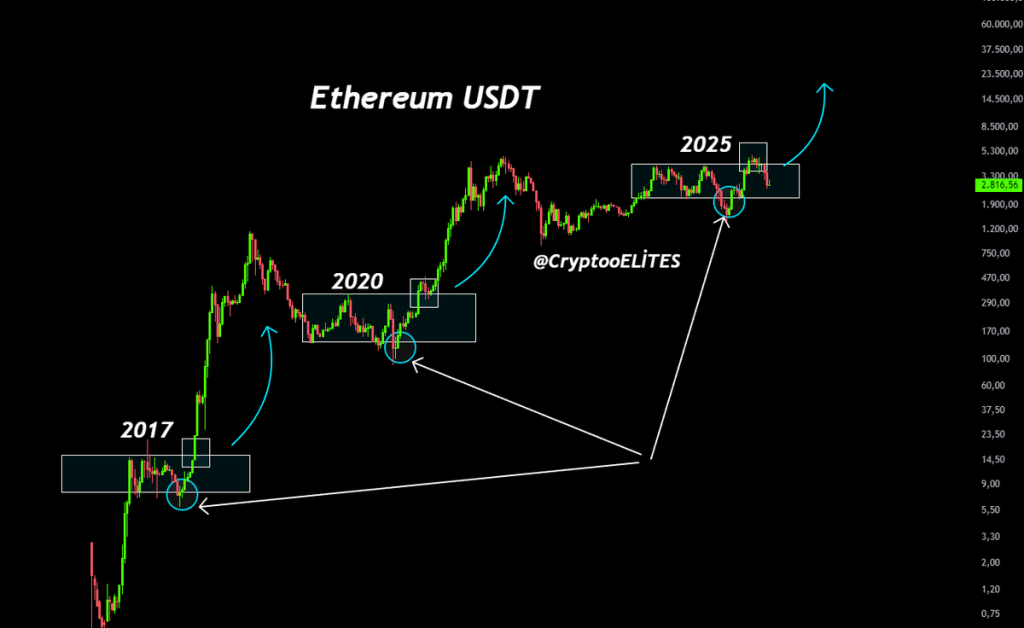
Zooming out, Ethereum’s current consolidation zone looks strikingly similar to previous cycle setups in 2017 and 2020 — both of which ended in explosive breakouts.
 Source: X
Each cycle followed a repeated behavior pattern:
- Long consolidation near the midpoint of the macro trend
- A final shakeout or drop toward support
- A rapid expansion phase once liquidity returned
In the chart, 2025’s price action is mimicking this same structure, suggesting ETH could be nearing the end of its consolidation rather than beginning a deeper downtrend.
What Comes Next for ETH Price?
Ethereum’s latest correction has pushed the asset back into a historical “value zone,” but on-chain data suggests the pullback may be more of an opportunity than a setback. Whales continue to accumulate, staking deposits remain strong, and ETH’s broader market structure still resembles previous pre-breakout phases. While short-term volatility may persist, the underlying fundamentals point to a network that is strengthening beneath the surface—setting the stage for a potential recovery once market sentiment stabilizes.
If ETH can reclaim the $3,100–$3,250 band with strong volume, the next major leg toward the $3,800–$4,200 region becomes increasingly likely. And if history continues to rhyme, Ethereum may be positioning for a much larger move later in 2025.
You May Also Like

Circle Expands USDC Into Africa Through Sasai Deal, Targeting Cross-Border Payments Boom

Hoskinson to Attend Senate Roundtable on Crypto Regulation

