Litecoin Price Forecast: LTC holders’ profit-taking activity reaches three-month high
- Litecoin price stabilizes around $85 on Thursday after recovering 6% so far this week.
- On-chain data suggests bearish signals as LTC profit-taking activity reaches a three-month high.
- Santiment data indicate that a specific whale has offloaded 340,000 LTC tokens.
Litecoin (LTC) is stabilizing at around $85 at the time of writing on Thursday, having recovered 6% so far this week. On-chain data indicate early bearish signals for LTC as holders’ profit-taking activity reaches a three-month high and dormant wallets’ activity increases, signaling growing selling pressure. Additionally, a specific whale has offloaded 340,000 LTC tokens, signaling a bearish outlook for its price.
Three reasons why LTC hints at bearish decline
Litecoin’s price started this week on a positive note, recovering nearly 6% on Monday following the announcement of the Iran-Israel ceasefire, which supported the risk-on sentiment. LTC price consolidated around $85 for the next two days, and at the time of writing on Thursday, it hovers around this level.
Examining its on-chain metrics data provides a clear picture of LTC and hints at early bearish signs.
Santiment's Network Realized Profit/Loss (NPL) metric indicates that LTC holders are booking some profit.
As shown in the graph below, the NPL experienced a significant spike on Wednesday, reaching its highest level since the end of March. This spike indicates that holders are, on average, selling their bags at a significant profit and increasing the selling pressure.
Litecoin NPL chart. Source: Santiment
Santiment's Age Consumed index also shows bearish signs. The spikes in this index suggest dormant tokens (tokens stored in wallets for a long time) are in motion, and it can be used to spot short-term local tops or bottoms. As in the case of Litecoin, history shows that a decline followed the spikes in LTC’s price as holders moved their tokens from wallets to exchanges, thereby increasing selling pressure. The most recent uptick on Wednesday forecasted that LTC was ready for a downtrend.
Litecoin Age Consumed chart. Source: Santiment
Santiment’s Supply Distribution shows that a certain whale wallet holding LTC tokens between 100,000 and 1 million (red line) had offloaded 340,000 LTC tokens from Tuesday to Thursday, reducing its exposure, which could cause a decline in LTC prices.
LTC Supply Distribution chart. Source: Santiment
Litecoin Price Forecast: LTC bears are taking the lead
Litecoin price declined by 7% last week and retested its weekly support level at $77.19 on Sunday. However, it recovered most of its losses on Monday and hovered around the $85 level for the next two days. At the time of writing on Thursday, it continues to stabilize at around $85.
If LTC fails to close above the 50% price retracement level at $91.61 and faces a correction, it could extend the decline to retest its weekly support at $77.19.
The Relative Strength Index (RSI) hovers below its neutral level of 50, indicating bearish momentum.
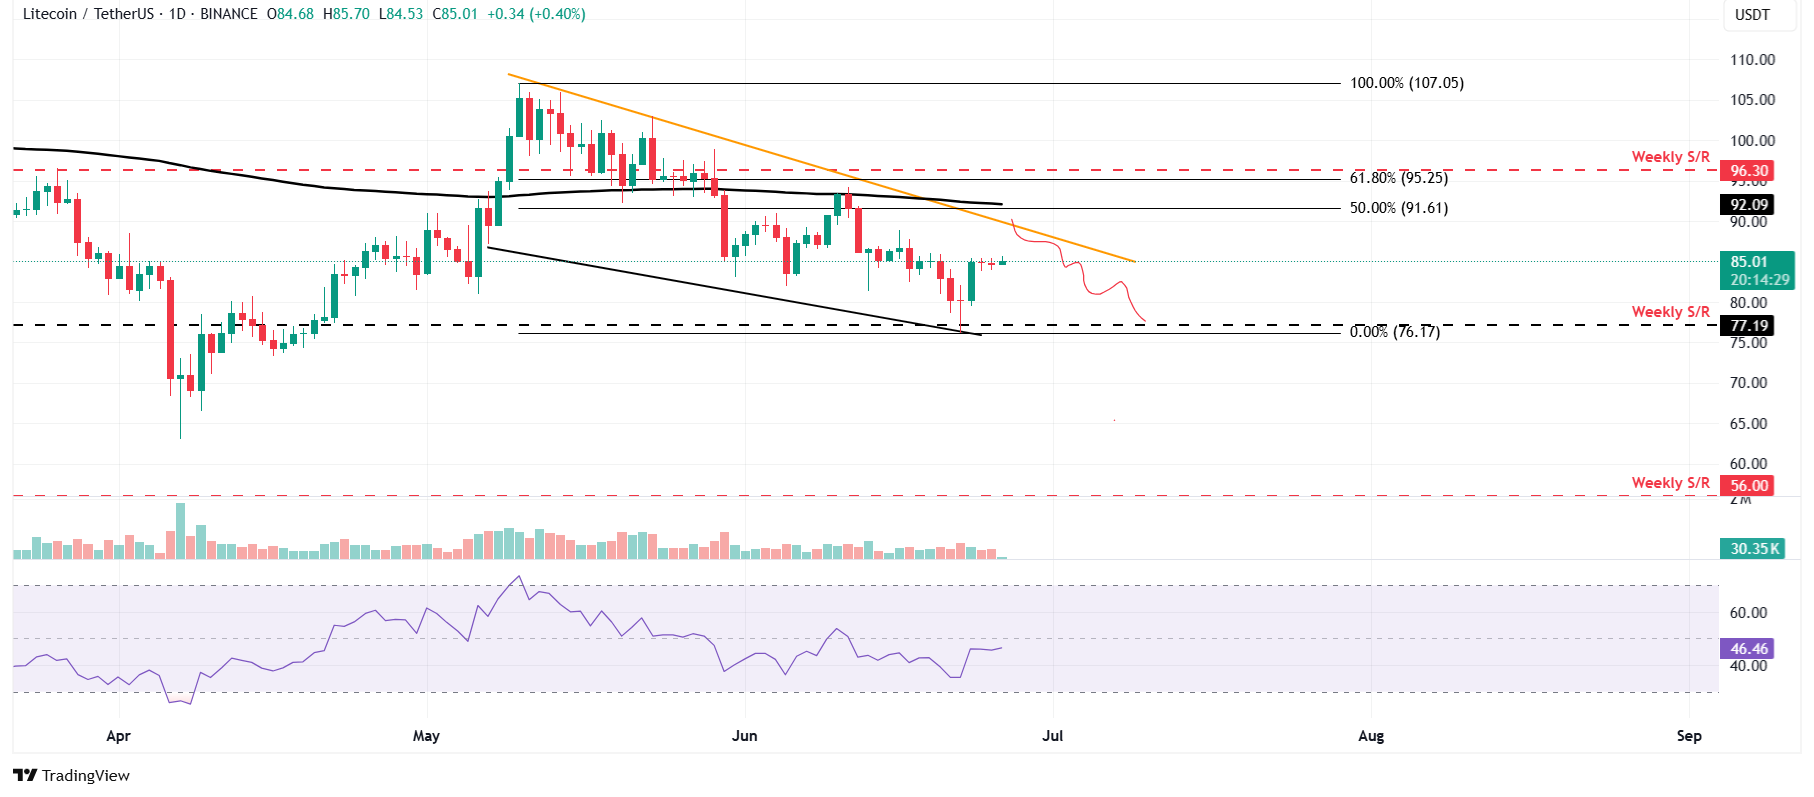
LTC/USDT daily chart
However, if LTC closes above the $91.61 resistance level, it could extend the rally toward its next weekly resistance at $96.30.


You May Also Like
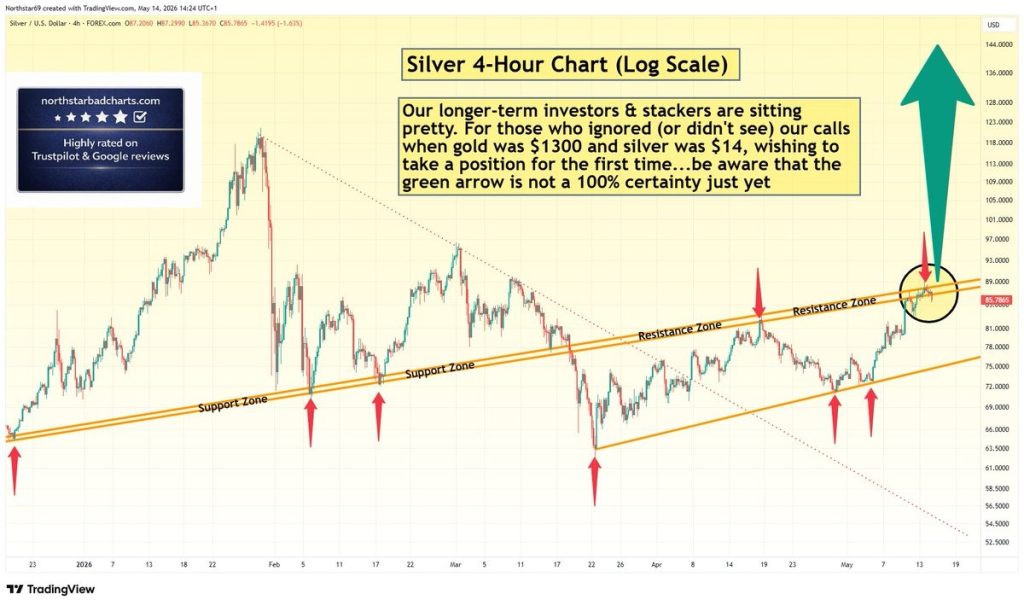
Silver Price Warning: Green Arrow Setup Is Not Confirmed – Wait for Clear Signal

Facebook spotlights African cinema in 6th ‘Made by Africa, loved by the world’ campaign