

Bitcoin price down: can BTC hold support after the latest sell-off?
 The phrase Bitcoin price down has returned to the headlines, but behind the scary candles there is a more nuanced story that traders should unpack. Moreover, with sentiment at extreme fear while the broader crypto market still holds a multi-trillion valuation, the current pullback looks less like capitulation and more like a decisive test of conviction.
 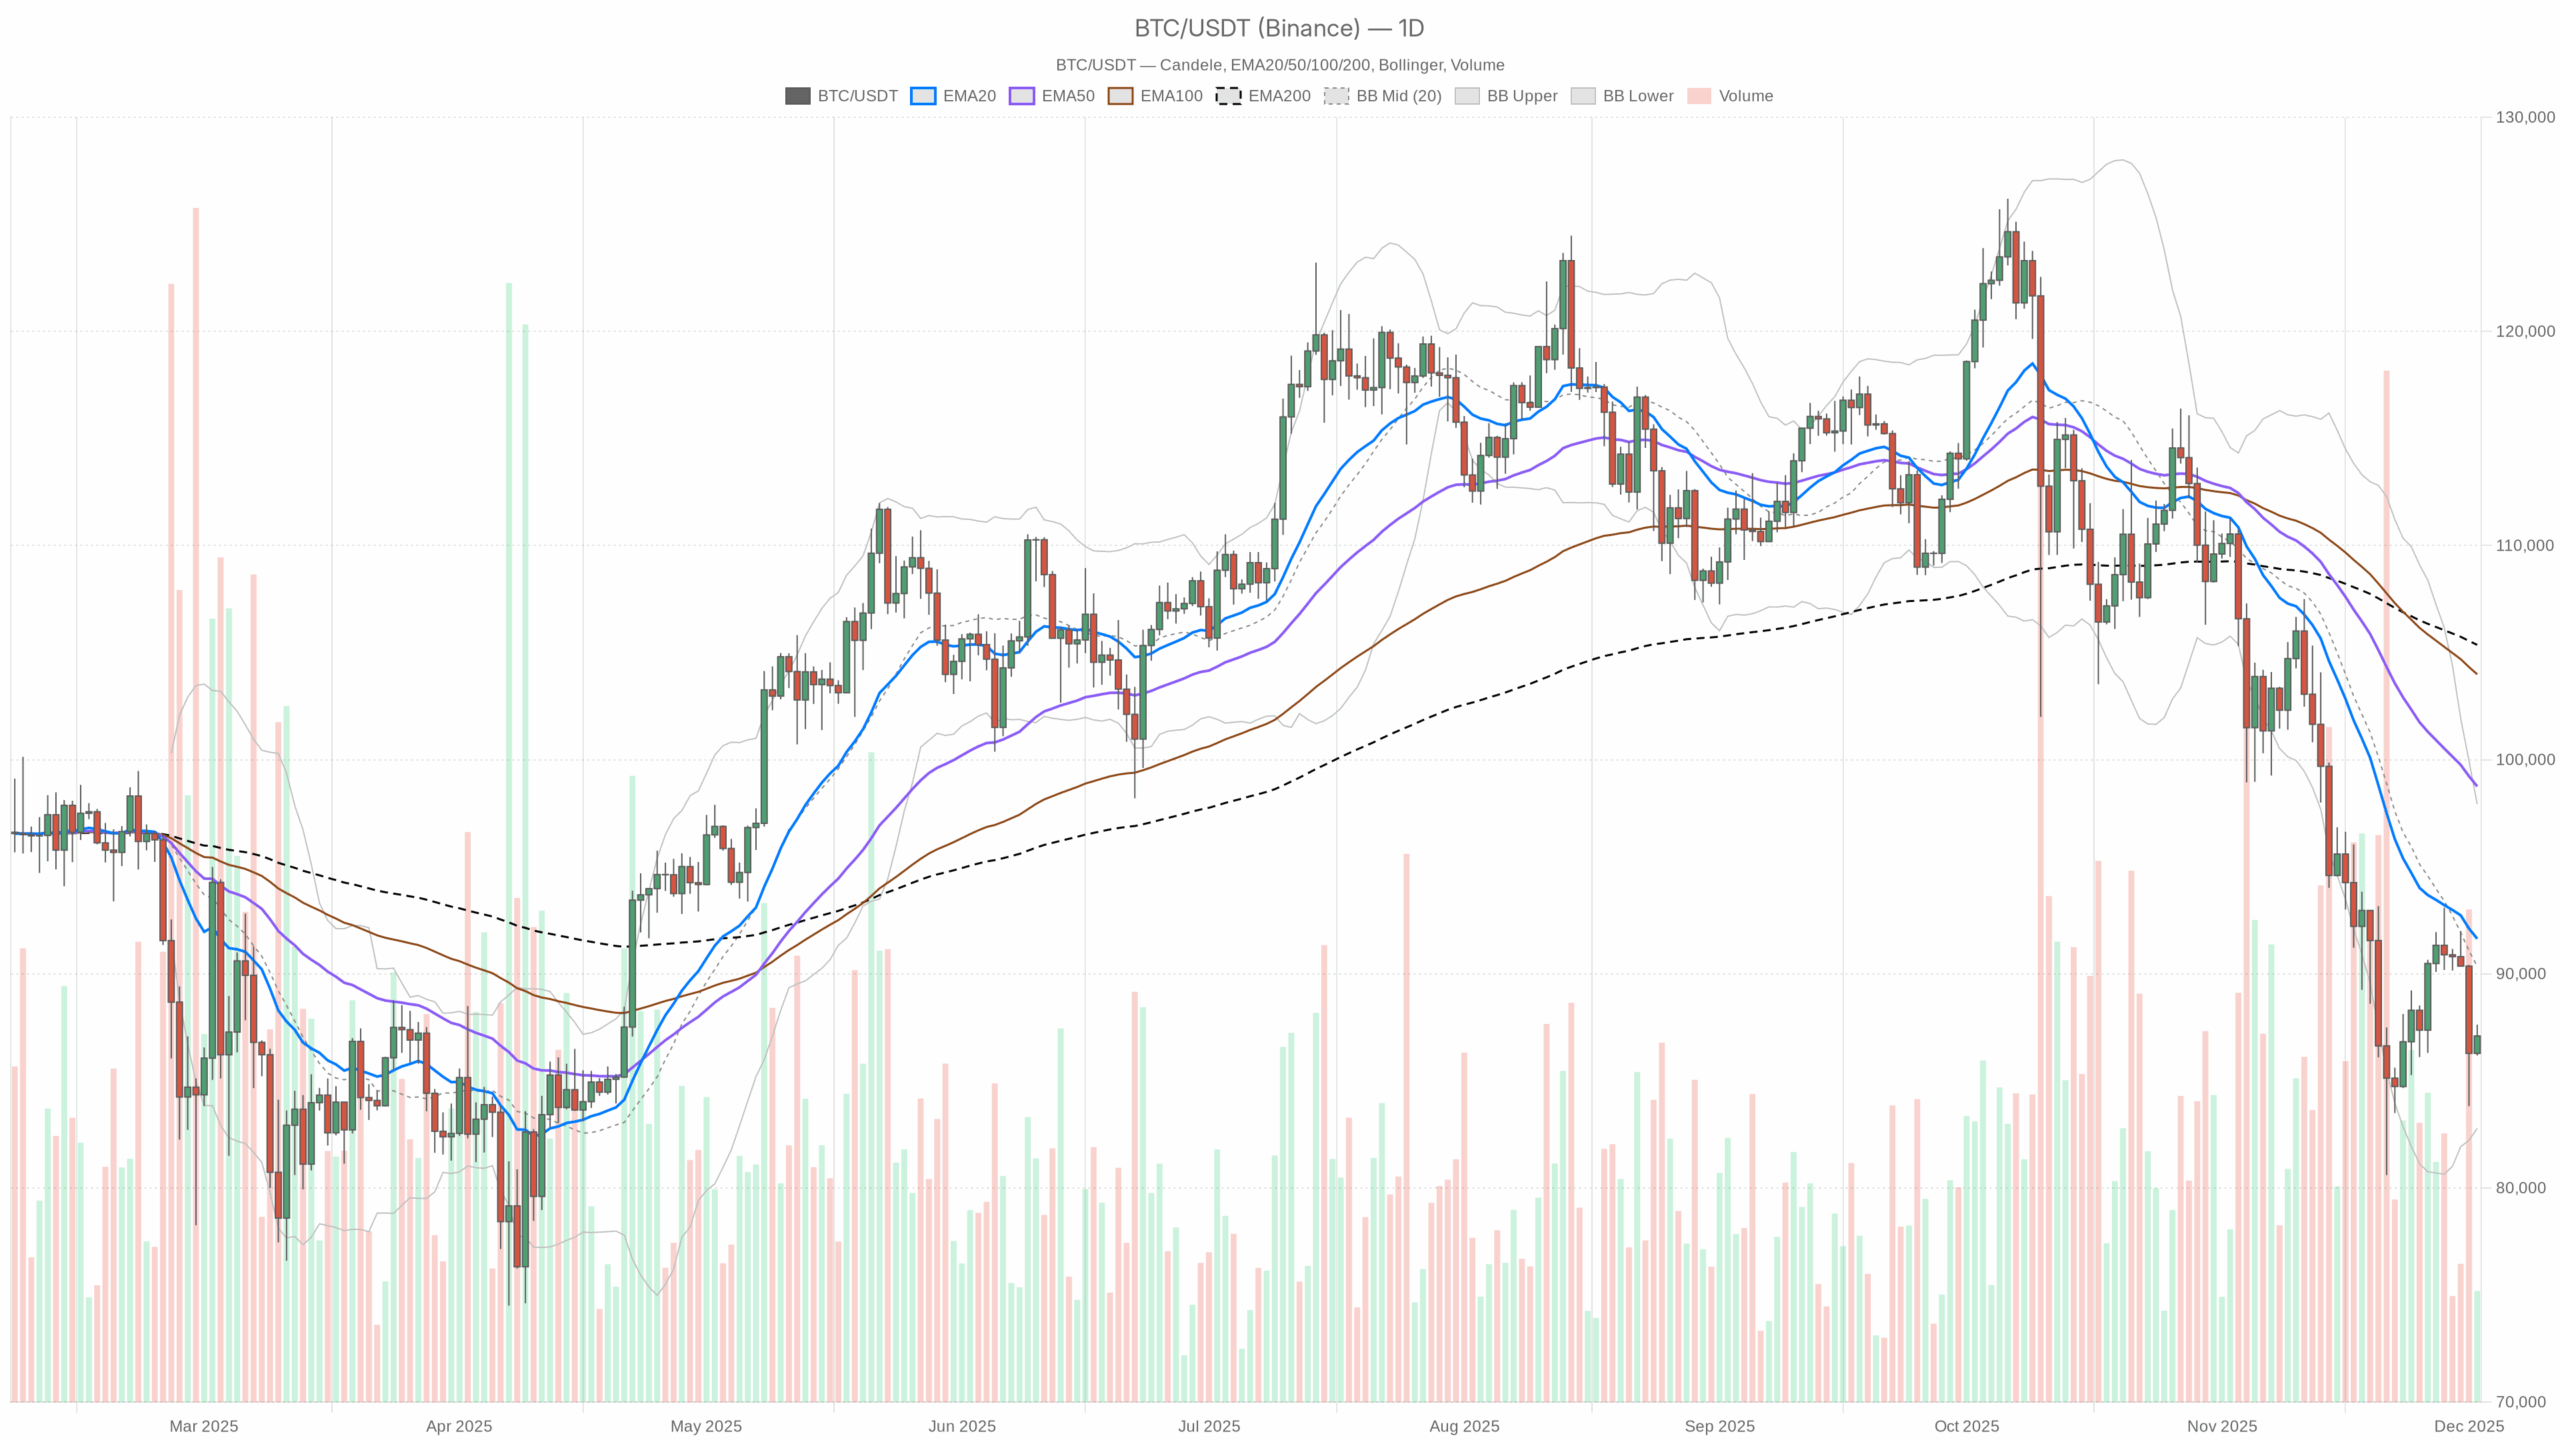 BTC/USDT — daily chart with candlesticks, EMA20/EMA50 and volume.
Summary
BTC is trading around 87,100 dollars, deep below its medium and long-term daily moving averages, confirming a dominant bearish regime on the higher timeframe. The daily RSI sits in the mid-30s, showing waning momentum but not yet true oversold panic. MACD remains negative on the 1-day chart, yet the histogram has started to contract, hinting that the downtrend may be losing strength. Volatility is elevated but not explosive, suggesting controlled selling rather than a waterfall crash. Moreover, Bitcoin‘s market dominance near 57% shows capital rotating back toward the benchmark rather than into riskier altcoins. Fear & Greed at Extreme Fear signals that many investors are already positioned defensively, which can limit further forced selling.
Bitcoin price down: Market Context and Direction
On the macro level, BTC is pulling back within a crypto market still worth roughly 3.0 trillion dollars, which indicates that the wider digital asset ecosystem has not broken structurally. Nevertheless, the leading coin has clearly been the source of stress in recent sessions, with mainstream outlets highlighting its struggle to reclaim the 100,000 dollar area this year. Moreover, Bitcoin’s dominance hovering around 57% underscores that, despite the correction, traders are not abandoning the asset in favor of speculative alternatives; instead, they are consolidating risk into the most liquid name.
That said, sentiment is fragile. The Fear & Greed Index prints 23, firmly in Extreme Fear territory, reflecting a market that is already anxious about further declines. This backdrop creates an intriguing asymmetry: while the daily technical picture is still negative, much of the emotional damage may already be done, leaving room for sharp relief rallies if sellers tire.
Technical Outlook: reading the overall setup
From a daily perspective, BTC trades near 87,099 dollars, below all key exponential moving averages. Price is under the 20-day EMA at about 91,640, the 50-day near 98,755, and the 200-day around 105,364. This wide separation confirms a mature bearish trend, with the short, medium, and long-term baselines all pointing above spot price. For positional traders, this alignment argues that the burden of proof lies with the bulls until at least the 20-day EMA is reclaimed.
The daily RSI at roughly 35 tells a complementary story. Momentum is clearly weak, consistent with a downtrend, yet the indicator has not dipped into classic oversold territory below 30. This implies sellers still retain control but are no longer pressing as aggressively as during the initial leg lower, raising the odds of a pause or consolidation phase.
MACD on the 1-day chart remains below zero, confirming negative momentum, but the MACD line at about -3,790 is now slightly above its signal line near -4,297. The positive histogram around 507 suggests a modest momentum inflection: the downtrend is not reversed, yet its intensity is easing. Often, such a pattern precedes either a sideways digestion or a more forceful bounce back toward the 20-day EMA.
Bollinger Bands add another layer. The mid-band sits around 90,357 dollars, with the upper band near 97,925 and the lower around 82,788. Price is trading between the middle and lower bands, which typically indicates sustained downside bias without full-blown capitulation. If BTC were to close repeatedly below the lower band, it would signal volatility expansion to the downside; for now, the configuration points more to grinding pressure than panic.
The daily ATR around 3,579 dollars highlights relatively high but controlled volatility. Swings of this magnitude make risk management crucial: position sizes must respect the fact that intraday moves of several thousand dollars are entirely plausible. As a result, both breakout traders and dip buyers need to plan entries and exits around broader ranges than in calmer periods.
Intraday Perspective and BTCUSDT token Momentum
Meanwhile, lower timeframes are painting a more balanced picture. On the 1-hour chart, BTC trades close to 87,126 dollars, above its 20-period EMA (around 86,735) but slightly below the 50 and 200 EMAs, clustered near 87,507 and 88,847. This mix suggests a short-term stabilization attempt within a still fragile medium-term environment. Intraday traders are probing the upside, yet they have not convincingly flipped the broader structure.
The hourly RSI near 54 is neutral to mildly positive, consistent with a modest intraday bounce rather than a full trend reversal. MACD on this timeframe shows the line just under zero but above its signal, with a positive histogram; this configuration supports the idea of a developing, yet tentative, recovery. On the 15-minute chart, the picture is slightly more constructive: price sits above both the 20 and 50 EMAs and just under the 200 EMA, while RSI hovers in the high 50s. Together, these signals hint at intraday bullish momentum that is still fighting against a dominant daily downtrend.
Key Levels and Market Reactions
Daily pivot levels help frame the battlefield. The central pivot sits close to 86,971 dollars, effectively where spot is oscillating. Holding this area keeps the door open for a push toward the first resistance zone around 87,757 dollars, which coincides with recent intraday highs. A firm break and consolidation above that band could invite a test of the Bollinger mid-line, strengthening the case for a broader mean-reversion bounce.
On the downside, the first significant support lies near 86,313 dollars, just below the pivot. A clean breakdown there would confirm that sellers are regaining the initiative, potentially steering price back toward the lower Bollinger Band near 82,788. In that case, traders would watch for signs of seller exhaustion such as long lower wicks, intraday RSI divergences, or sharp reversals off support.
Open your Investing.com account
This section contains a sponsored affiliate link. We may earn a commission at no additional cost to you.
Future Scenarios and Investment Outlook
Overall, the primary scenario remains bearish on the daily timeframe, as long as price holds below the 20-day EMA and the cluster of moving averages overhead. However, easing downside momentum, extreme fear, and stabilizing intraday charts together argue for a phase of consolidation or relief rather than an immediate further collapse. Swing traders may look for confirmation of a trend stabilization phase via higher lows on the daily chart, while longer-term investors might gradually scale in during weakness, always respecting the elevated volatility. Until key resistance zones are reclaimed, caution is warranted, but so too is openness to sharp countertrend rallies that can unfold quickly in such an emotional market.
This analysis is for informational purposes only and does not constitute financial advice.
Readers should conduct their own research before making investment decisions.
You May Also Like

South Korea Party Moves to Scrap Crypto Tax Plan

CME Group to launch options on XRP and SOL futures

