

SOL 1,600% Rally? Cantor Fitzgerald Reveals $1.28M Stake in SOL ETF
Cantor Fitzgerald’s latest Form 13F filing with the US Securities and Exchange Commission (SEC) has revealed that it now holds a position valued at $1.28 million in the Volatility Shares Solana ETF (SOLZ).
The filing shows 58,000 shares accumulated in mid‑November and marks the first officially documented exposure the firm has taken toward a regulated Solana‑linked investment product.
The purchase follows the SEC clearing a series of Solana exchange‑traded funds (ETFs) in September. Major issuers such as Fidelity, VanEck, and Canary have begun experimenting with staking components, index variations, and advanced custody models to determine how deep investor appetite might extend beyond Bitcoin and Ethereum.
A New Bullish Signal Flashes
Meanwhile, analyst Ali Martinez pointed out in a post on X that the TD Sequential indicator on the weekly chart has accurately forecasted trend reversals since early 2023. His latest chart shows the indicator printing a fresh buy signal, which could make SOL the next crypto to explode in 2025.
The chart also shows how previous 9‑count signals preceded sharp price surges. Each appearance near cycle highs and lows has been followed by multi‑month rallies or corrections.
Solana Price Analysis: Testing a Critical Trendline
Martinez further noted that Solana is once again hovering above a long‑standing support trendline that has triggered powerful rebounds since 2023. The weekly chart confirms this structure clearly.
Each time price dipped into this diagonal support, strong surges followed. First a 229% rally, then a 179% climb, and later the explosive 1,634% price surge, as shown by the chart below.
With SOL now trading near $128, the price action sits precisely on this trendline. Technical indicators show that the market is cooling off rather than collapsing. RSI floats near the mid‑30s while MACD displays weakening bearish momentum.
The accumulation/distribution readings remain relatively stable, showing no aggressive outflows despite recent market corrections.
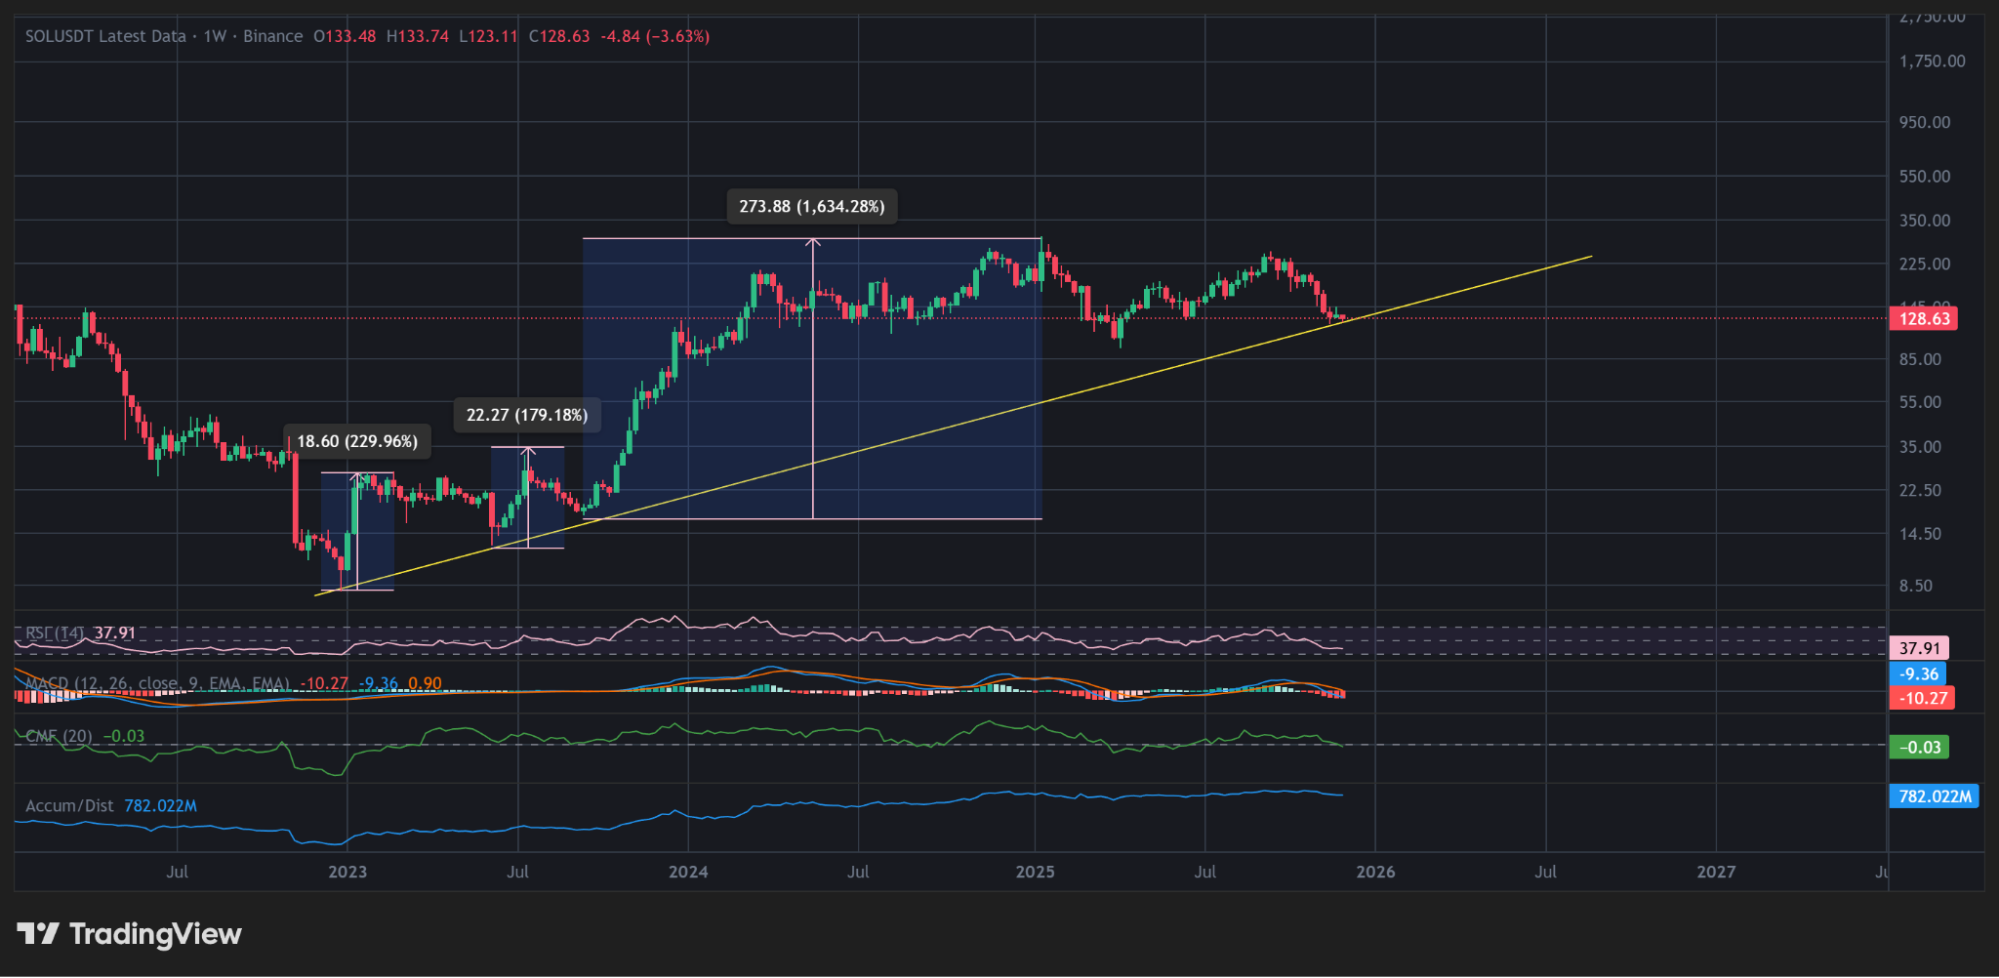
SOL defending major trendline | Source: TradingView
If bulls defend the trendline once again, Solana could attempt a rebound toward the immediate resistance region around $150. A successful break above this level would position SOL to retest the $175–$185 supply zone, where prices were previously rejected.
If ETF inflows continue and institutional adoption rises, a retest of $220–$240 region could be seen. On the other hand, failure to maintain the long‑term trendline support would introduce a bearish drop to $115, followed by deeper support near $100.
nextThe post SOL 1,600% Rally? Cantor Fitzgerald Reveals $1.28M Stake in SOL ETF appeared first on Coinspeaker.
You May Also Like

BlackRock Increases U.S. Stock Exposure Amid AI Surge

South Korea Party Moves to Scrap Crypto Tax Plan

