Zcash crypto today: price pressure, sentiment and key levels

Zcash crypto today sits in a delicate balance between a shaken higher-timeframe structure and a more constructive intraday tone. Traders are trying to understand whether the recent sell-off is simply a deep pullback within a broader uptrend, or the start of a longer phase of digestion under heavy market-wide uncertainty.
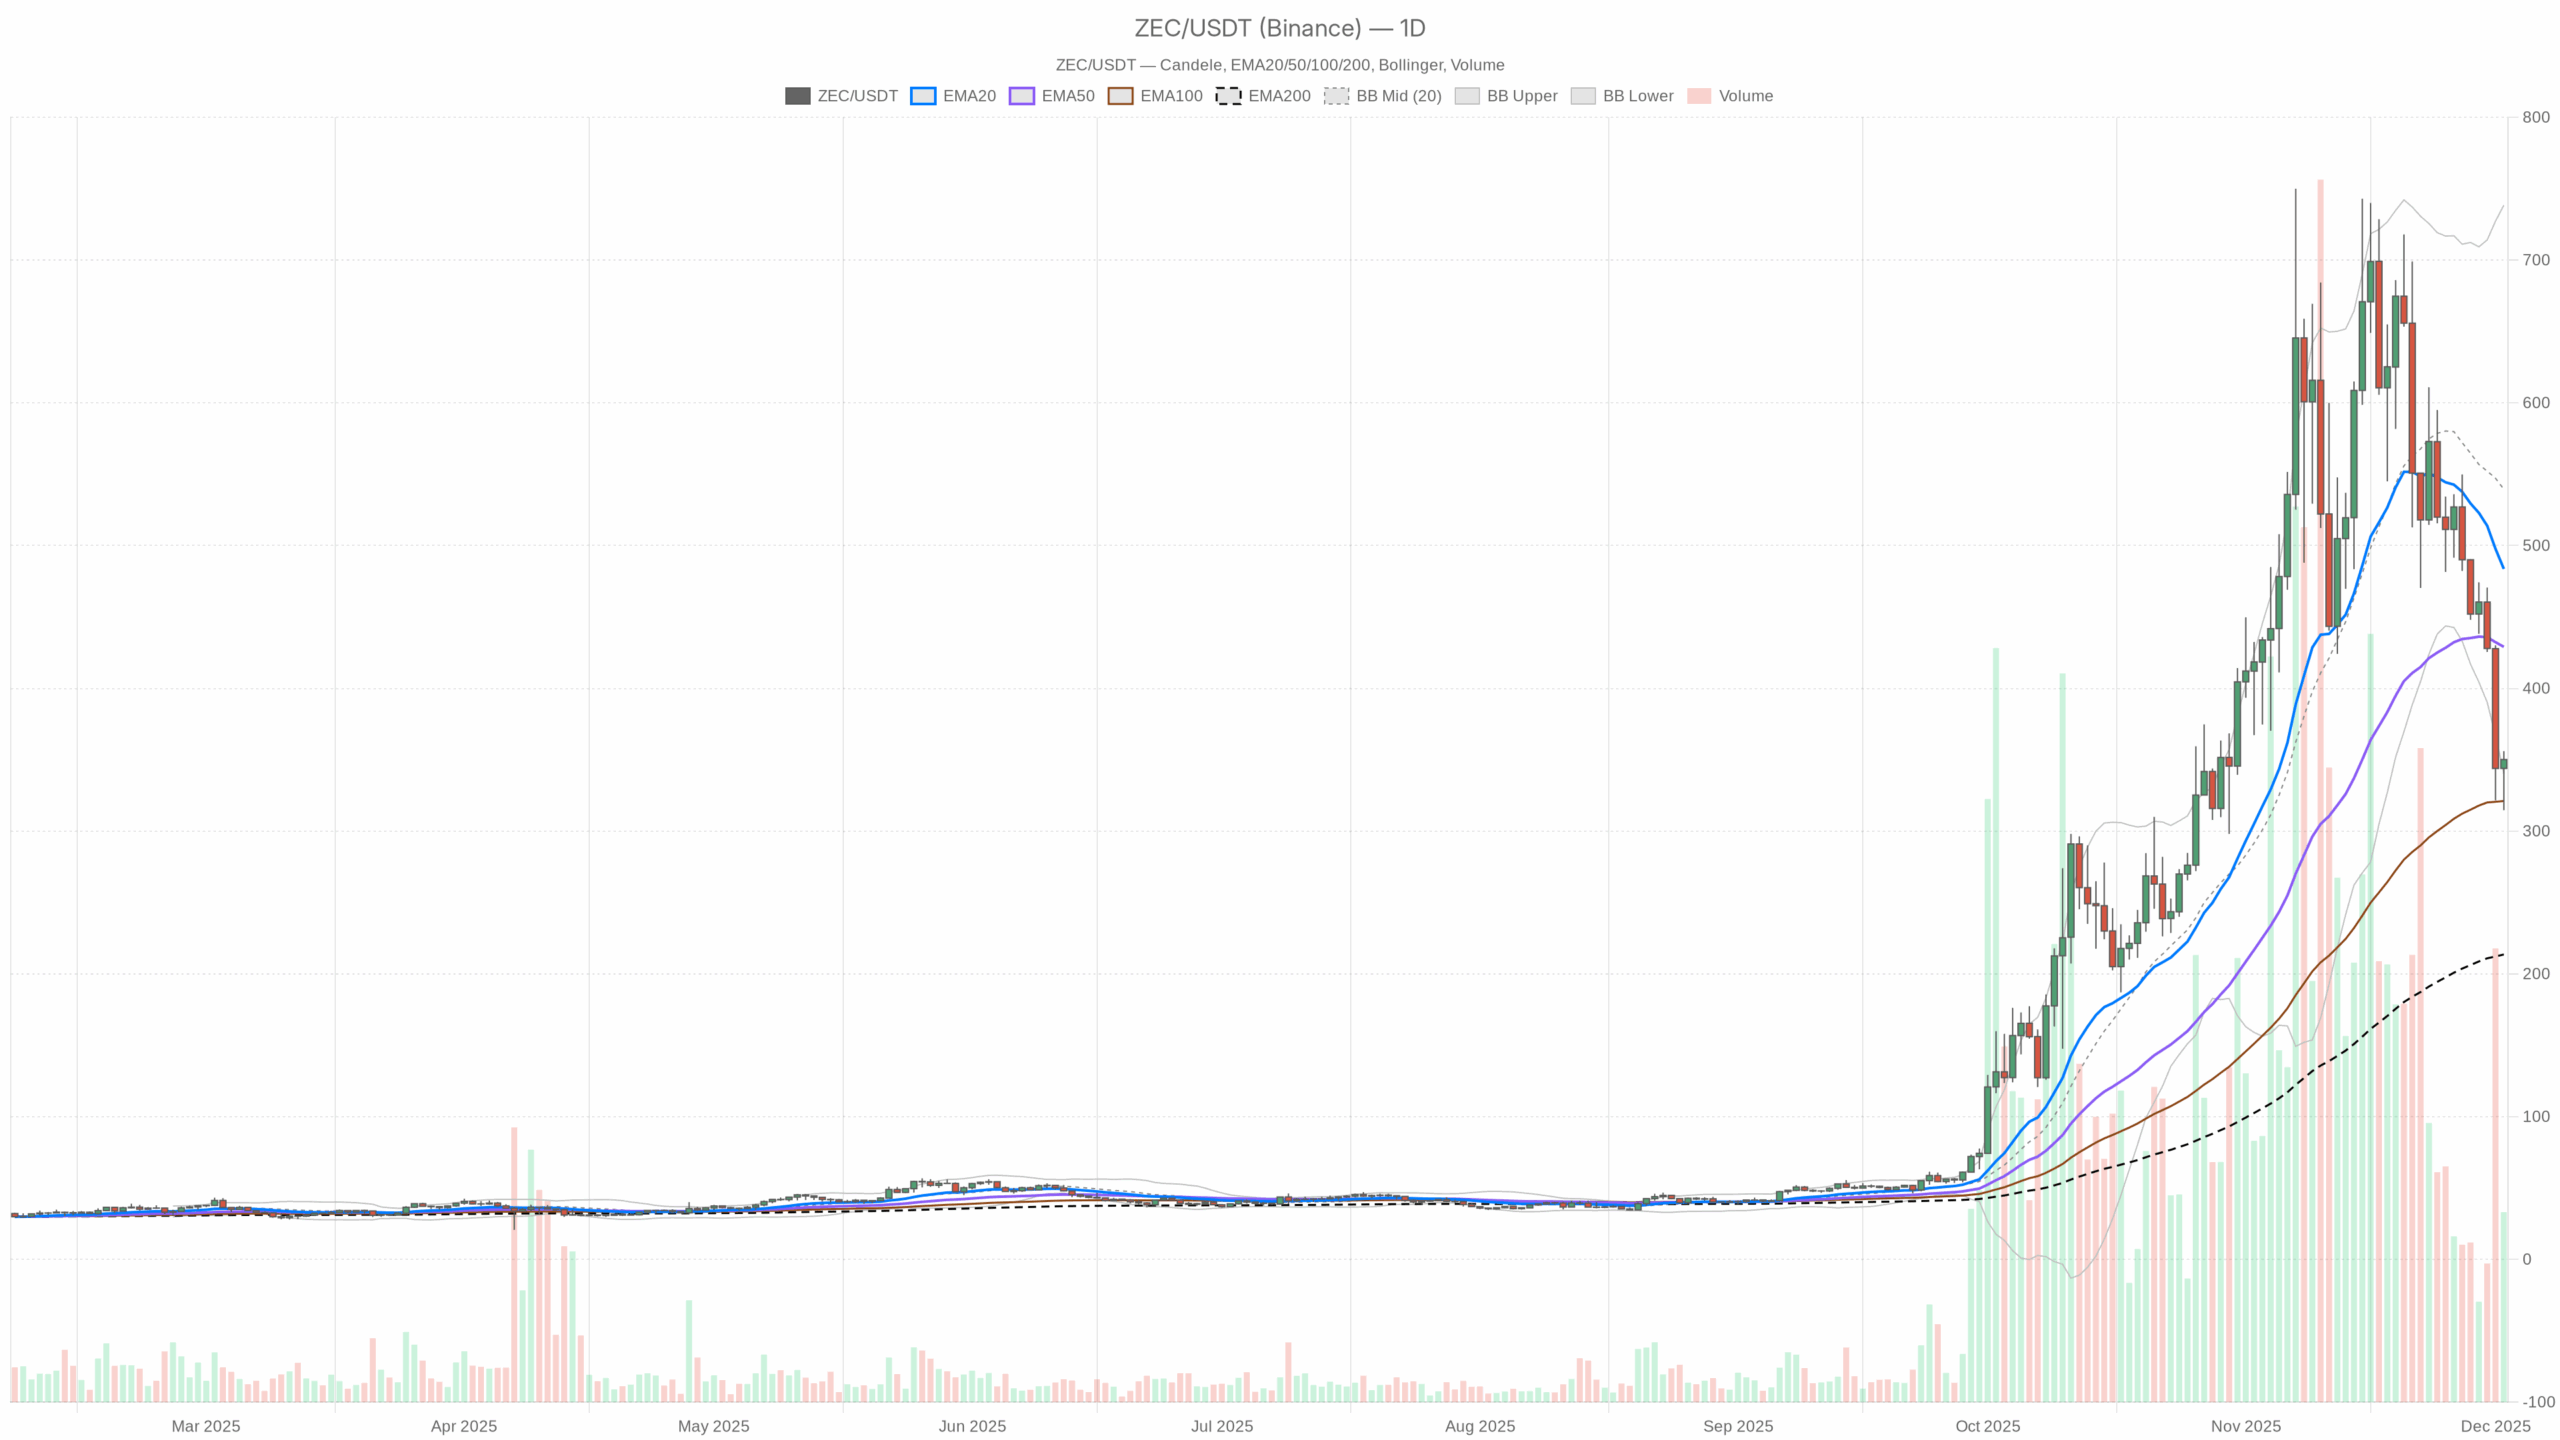 ZEC/USDT — daily chart with candlesticks, EMA20/EMA50 and volume.
Summary
The asset trades around 350 USDT, well below its recent moving averages, signaling a weakened medium-term trend. Daily indicators lean cautious, with momentum still subdued and buyers not yet in full control. However, intraday data show signs of stabilization and modest upside bias as price reclaims short-term averages. Volatility is elevated on the daily chart, so swings around key levels can be wide. Meanwhile, the wider crypto market cap is rising over 6% in 24 hours, yet sentiment remains in Extreme Fear, hinting at a fragile backdrop. Overall, investors face a mixed landscape where patience and strict risk management are crucial.
Zcash crypto today: Market Context and Direction
The broader environment is surprisingly constructive, with the total crypto market capitalization near 3.15 trillion dollars and up about 6.1% over the last day. Moreover, Bitcoin dominance hovers around 57.4%, confirming that the leading coin is still absorbing most of the new liquidity. In contrast, the sentiment gauge tells a different story: the Fear & Greed Index sits at 23, in Extreme Fear, meaning that emotional conditions are still defensive despite rising prices. This combination usually points to an early or fragile phase of risk-on, where participants reluctantly add exposure.
Within this backdrop, ZECUSDT shows a daily regime labeled as neutral, reflecting the current indecision. The pair is not yet in a confirmed bullish environment, but the broader market push and strong activity on major DeFi venues, where fees have expanded sharply over the last month, suggest that capital is actively rotating across the ecosystem. That said, with Bitcoin steering the ship, privacy-focused assets must still prove they can attract sustained inflows beyond speculative bursts.
Technical Outlook: reading the overall setup
On the daily timeframe, price closes around 350.1 USDT, materially below the 20-day EMA at 483.65 and the 50-day EMA at 429.07. This configuration shows a short- to medium-term downtrend within a still elevated longer-term structure, because the 200-day EMA at 213.58 remains far below spot. The distance between price and the faster EMAs indicates sellers have recently dominated, while the positive gap above the 200-day line keeps the door open for a longer-cycle recovery once momentum turns.
The RSI at 14 periods stands near 37, below the midline but not yet oversold. This placement hints at bearish momentum that is losing intensity rather than a full capitulation. It implies that selling pressure has cooled somewhat, yet buyers have not reclaimed clear control. Traders often interpret this zone as a waiting room: either price stabilizes and RSI curls higher, or another leg down drags it closer to classic oversold territory.
Daily MACD deepens this narrative. The MACD line sits around -20.54, well below its signal at 14.11, with a negative histogram near -34.65. This structure confirms a bearish momentum regime, where previous down moves are still echoing through the trend-following indicators. However, when the histogram is strongly negative, traders start watching for signs of exhaustion or a gradual narrowing that would point toward a potential momentum inflection.
Bollinger Bands on the daily chart place the middle band at 539.44, with the upper around 738.46 and the lower near 340.43. Price currently hovers just above the lower band, which typically signals downside extension with rising mean-reversion potential. It suggests the asset has stretched to the lower volatility envelope and could either consolidate sideways or stage a technical bounce back toward the mid-band, especially if sellers begin to tire.
The 14-day ATR is about 75.02, a high value relative to the current price zone. This indicates elevated volatility, meaning that even intraday fluctuations can be large when measured in percentage terms. As a result, position sizing and wider stop placement become essential, since normal noise can otherwise trigger premature exits.
Intraday Perspective and ZECUSDT token Momentum
On the hourly timeframe, the picture looks more balanced. Price near 350.04 trades slightly above the 20-period EMA at 338.99 but still below the 50-period EMA at 364.7 and the 200-period EMA at 453.82. This setup reflects a short-term attempt to rebuild bullish structure within a broader corrective context. It hints that intraday dip buyers are active, but they are still working underneath heavier resistance from higher moving averages.
The hourly RSI at 53.47 sits just above the neutral 50 line, implying mildly positive momentum intraday. Meanwhile, MACD on this timeframe shows the line at -7.15 versus a signal at -11.49 and a positive histogram around 4.33. This alignment points to early bullish momentum crossover, where the short-term trend is trying to turn up even as the longer trend remains cautious.
Zooming further in, the 15-minute chart paints an even more optimistic short-term story. Price at 350.04 stands above both the 20-period EMA (334.98) and the 50-period EMA (333.58), while still below the 200-period EMA at 363.94. The RSI around 70 suggests strong intraday momentum, bordering on overbought, which often signals that short-term traders have chased the move and may soon pause or take profits. MACD on this micro timeframe is comfortably positive, confirming that recent hours have belonged to the bulls.
Key Levels and Market Reactions
Daily pivots help map out where this tug-of-war could intensify. The main daily pivot sits close to 340.25, just below current prices, acting as a first reference support after the latest rebound. A deeper cushion emerges around the S1 area near 324.5; if the asset slips back toward this zone, traders will watch to see whether buyers quickly defend it, which would underline a developing accumulation phase after the recent decline.
On the upside, the first important reaction area appears around 365.86, roughly aligning with intraday resistance clusters. A clean move and sustained hold above that band would reinforce the idea of a short-term bullish reversal attempt, opening space toward the confluence of the 50-day EMA around 429 and the Bollinger midline near 539. In such a scenario, every approach to these higher levels will test how committed new buyers really are after weeks of pressure.
If you want to monitor markets with professional charting tools and real-time data, you can open an account on Investing using our partner link:
Open your Investing.com account
This section contains a sponsored affiliate link. We may earn a commission at no additional cost to you.
Future Scenarios and Investment Outlook
Overall, the main scenario on the daily chart remains cautiously bearish to neutral, with price still compressed near the lower Bollinger Band and below short-term moving averages. However, improving intraday momentum and modest bullish signals on hourly and 15-minute indicators hint that the market is at least attempting to build a floor. If global crypto capitalization continues to expand while fear gradually subsides, this token could transition from defensive consolidation toward a more constructive recovery phase. Until daily momentum confirms a shift, though, investors may prefer staggered entries, clear invalidation levels under nearby supports, and a focus on capital preservation while they wait for trend confirmation.
This analysis is for informational purposes only and does not constitute financial advice.
Readers should conduct their own research before making investment decisions.
You May Also Like

XRP Price Prediction: Targets $1.50-$1.60 by April 2026 Amid Technical Consolidation

Solana Price Prediction: Weekly Support Still Intact