

XRP Price Rebounds From Lows as Bulls Push Recovery Toward Key Levels
XRP price started a recovery wave from $1.9840. The price is now rising above $2.120 and might face hurdles near the $2.250 pivot level.
- XRP price started a recovery wave from the $1.9840 zone.
- The price is now trading above $2.120 and the 100-hourly Simple Moving Average.
- There was a break above a key bearish trend line with resistance at $2.150 on the hourly chart of the XRP/USD pair (data source from Kraken).
- The pair could continue to move up if it settles above $2.250.
XRP Price Recovers Over 5%
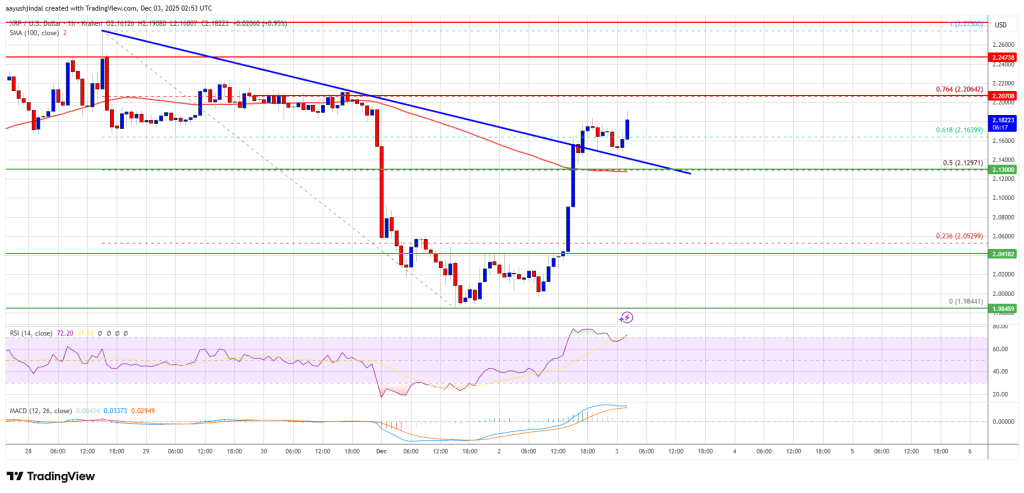
XRP price extended losses below the $2.050 support, like Bitcoin and Ethereum. The price even spiked below $2.00 before the bulls appeared. A low was formed at $1.9844, and the price is now attempting to recover.
There was a move above the $2.050 and $2.120 levels. The bulls were able to push the price above the 50% Fib retracement level of the downward move from the $2.2750 swing high to the $1.9844 low. Besides, there was a break above a key bearish trend line with resistance at $2.150 on the hourly chart of the XRP/USD pair.
The price is now trading above $2.150 and the 100-hourly Simple Moving Average. If there is a fresh upward move, the price might face resistance near the $2.20 level or the 76.4% Fib retracement level of the downward move from the $2.2750 swing high to the $1.9844 low.
The first major resistance is near the $2.250 level. A close above $2.250 could send the price to $2.320. The next hurdle sits at $2.350. A clear move above the $2.350 resistance might send the price toward the $2.40 resistance. Any more gains might send the price toward the $2.450 resistance. The next major hurdle for the bulls might be near $2.50.
Another Decline?
If XRP fails to clear the $2.250 resistance zone, it could start a fresh decline. Initial support on the downside is near the $2.120 level. The next major support is near the $2.10 level.
If there is a downside break and a close below the $2.10 level, the price might continue to decline toward $2.050. The next major support sits near the $2.00 zone, below which the price could continue lower toward $1.920.
Technical Indicators
Hourly MACD – The MACD for XRP/USD is now gaining pace in the bullish zone.
Hourly RSI (Relative Strength Index) – The RSI for XRP/USD is now above the 50 level.
Major Support Levels – $2.120 and $2.10.
Major Resistance Levels – $2.20 and $2.250.
You May Also Like

Web3 is sick, but the cure isn't AI.
Venice Token Surges 18.3% as Market Cap Crosses $298M: What’s Driving VVV?

