ADA Cardano at $0.44: can the market base hold for 2026?
 ADA Cardano is trading in a delicate balance, caught between a still-fragile altcoin backdrop and early signs of speculative interest returning to the market. In this piece we look at how the daily and intraday structure are lining up, and what the key levels suggest about whether the current phase resolves into a sustained recovery or yet another failed bounce.
 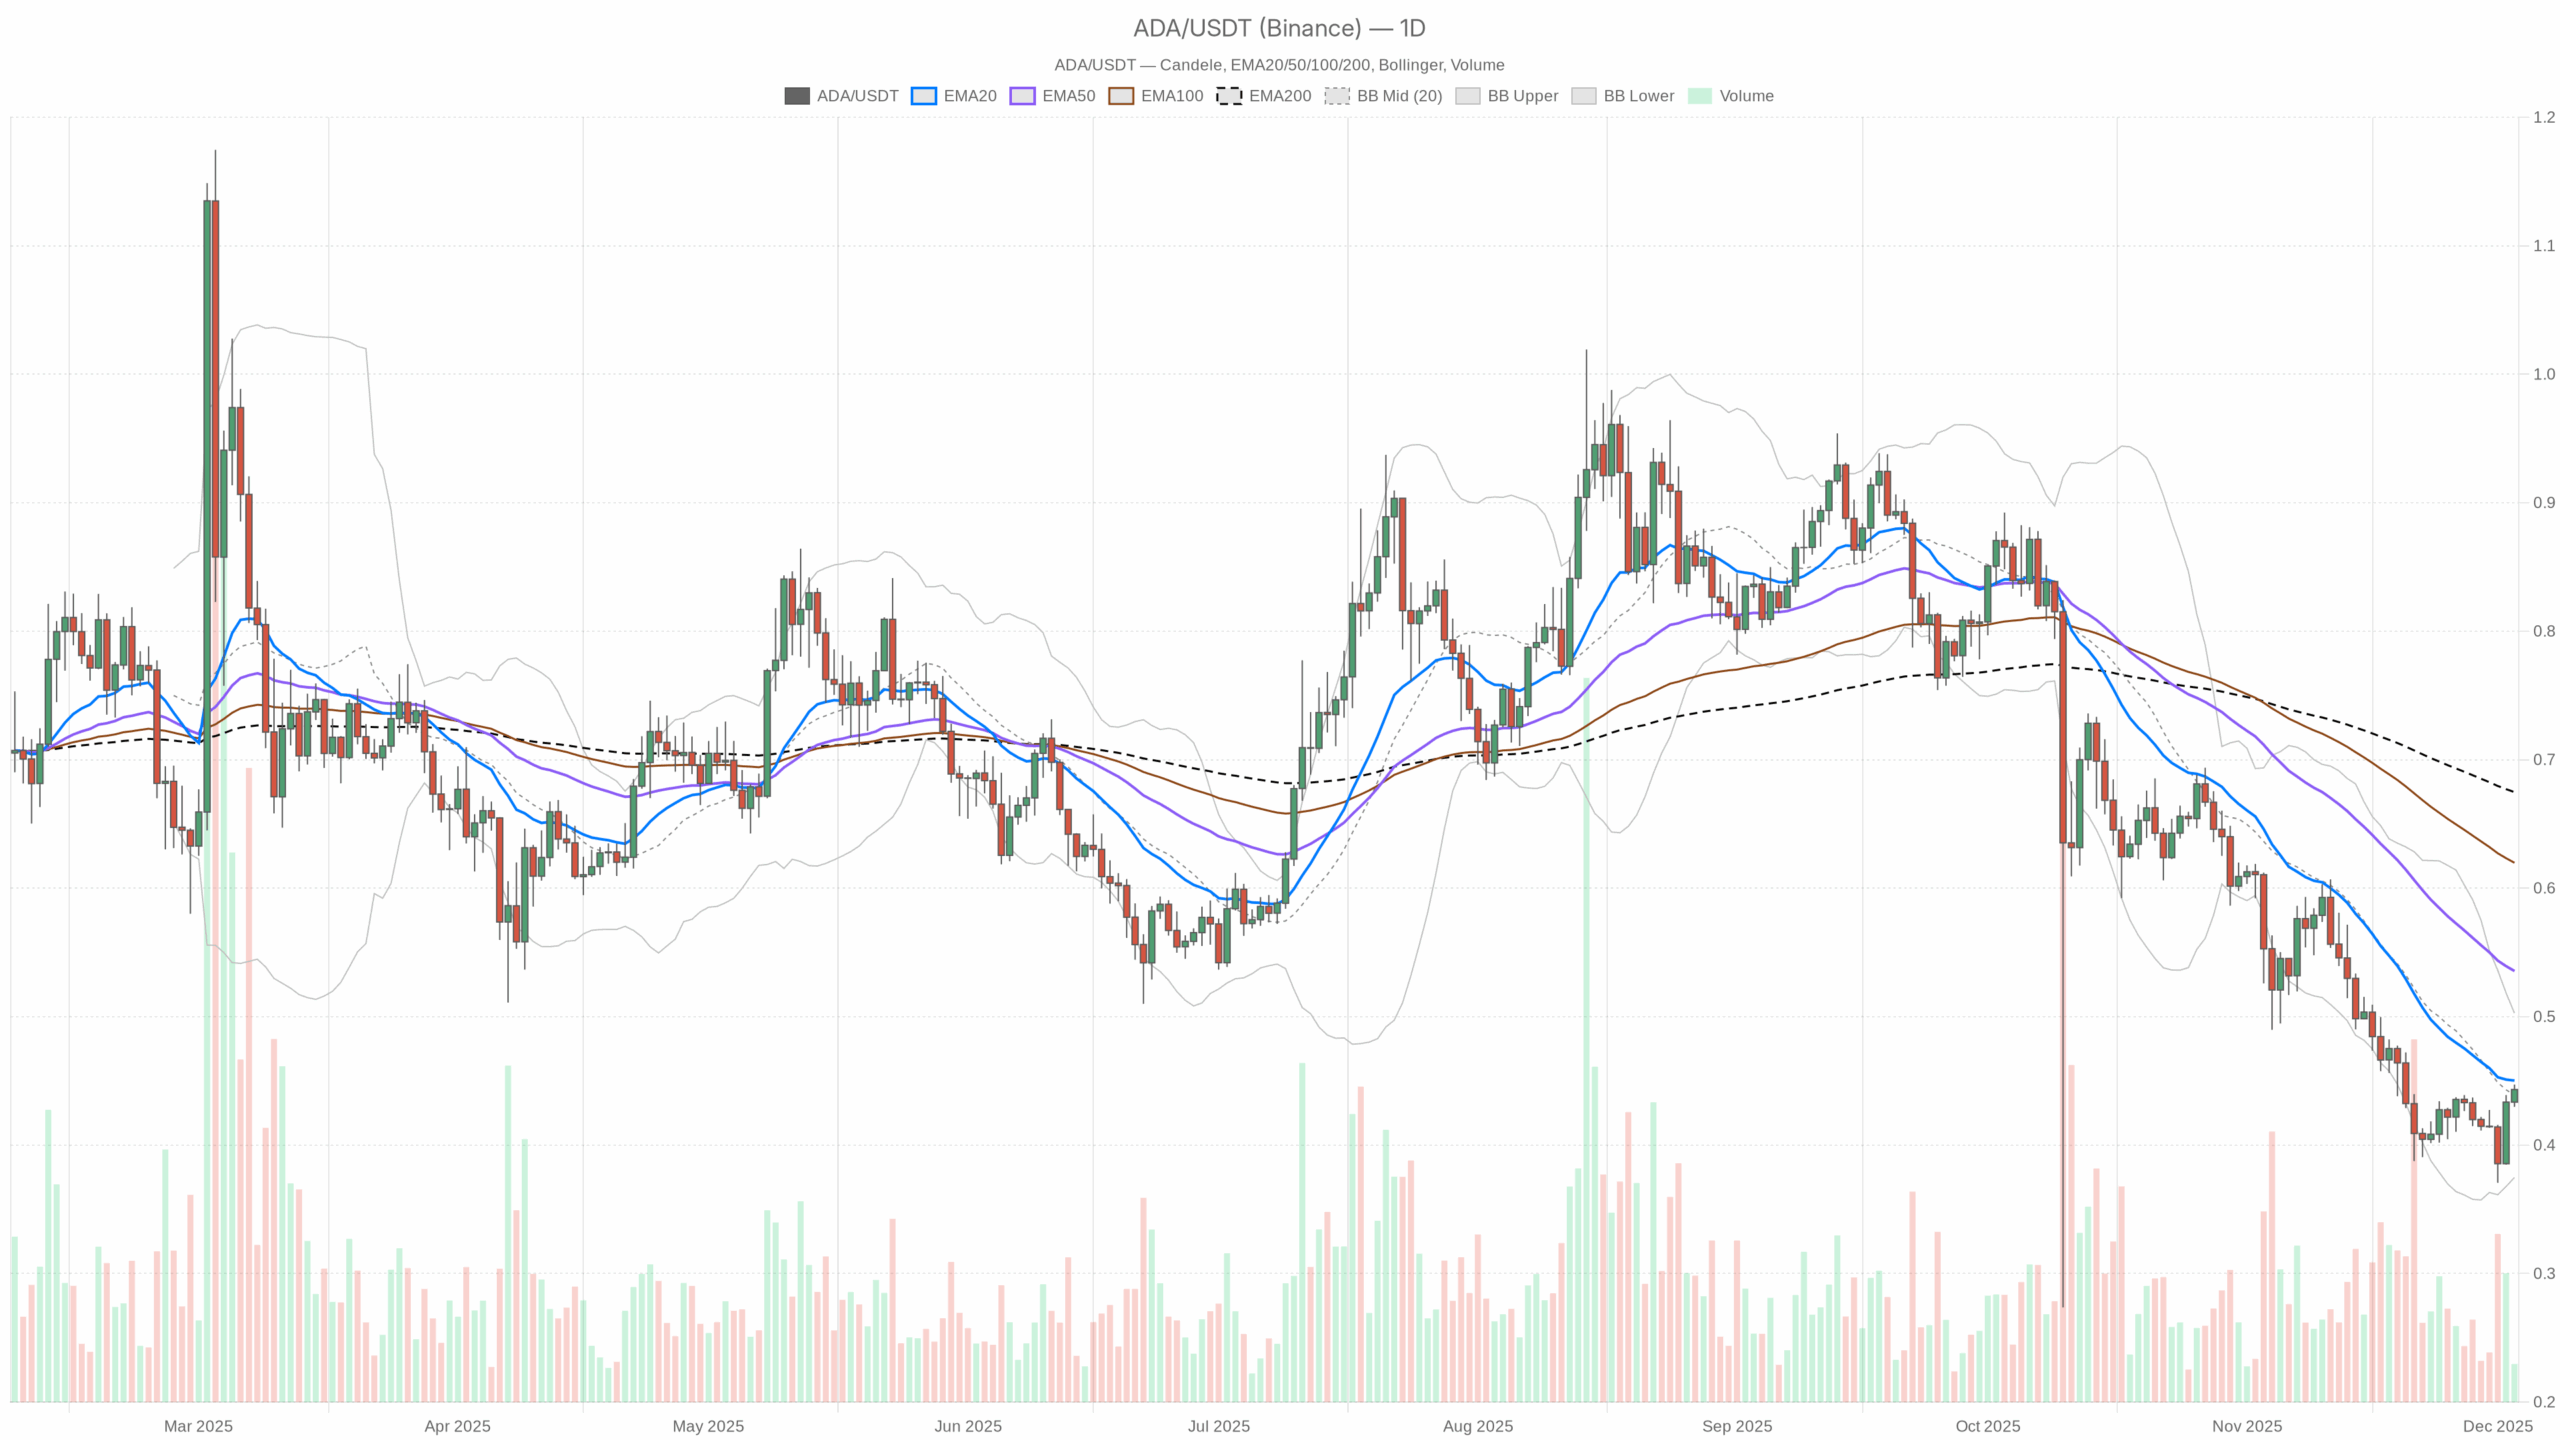 ADA/USDT — daily chart with candlesticks, EMA20/EMA50 and volume.
Summary
The broader crypto market is expanding again, with total capitalization above $3.2 trillion and rising nearly 7% in the last 24 hours. However, Bitcoin dominance near 57% shows capital remains concentrated in the majors, leaving altcoins more vulnerable and selective. On the daily chart, ADAUSDT sits in a bearish market regime, trading below its 20, 50 and 200-day exponential moving averages. Momentum is weak but not oversold, while volatility is relatively contained, pointing more to a grind than a crash. Intraday, by contrast, buyers are attempting a push, with short-term trend metrics tilting bullish. Overall, the picture is one of a market trying to base, but still needing proof of sustainable demand.
ADA Cardano: Market Context and Direction
The macro backdrop is supportive in terms of liquidity, with global crypto capitalization above $3.23 trillion and solid daily turnover above $180 billion. Moreover, the 24-hour market cap change of almost 7% underscores a phase of risk appetite expansion, even if it is still heavily skewed toward Bitcoin and a handful of large caps. With Bitcoin capturing more than 57% of total value, many secondary networks must work harder to attract incremental flows.
Sentiment data reflect this cautious stance. The Fear & Greed Index sits at 28 (Fear), signaling that investors remain skeptical and quick to lock in gains. That said, fearful environments often coincide with early accumulation phases, where more patient capital quietly builds positions while retail interest is muted. For this token, that means any signs of sustainable bidding are more likely to emerge gradually than in a sudden vertical move.
On-chain activity around its DeFi ecosystem is mixed but alive. DEXs such as Minswap still generate sizeable cumulative fees, while others like WingRiders and MuesliSwap show strong percentage swings over the last month. As a result, the network retains a functioning economic layer, but flows look tactical rather than euphoric, consistent with a market still in search of a durable narrative.
Technical Outlook: reading the overall setup
On the daily timeframe, price is clustered around $0.44, right on the central pivot and the middle of the Bollinger Bands at the same level. This positioning suggests a phase of price equilibrium, where neither buyers nor sellers currently dominate. However, the 20-day EMA at $0.45, the 50-day near $0.54 and the 200-day around $0.67 all sit above spot, mapping out a classic bearish alignment of moving averages. Until price reclaims at least the shortest of these averages with conviction, rallies are vulnerable to profit taking.
The daily RSI at about 43 leans slightly to the bearish side but is far from capitulation. This level usually corresponds to a market in a controlled downtrend rather than panic selling, leaving room both for short squeezes and for renewed declines if macro conditions deteriorate. Meanwhile, the MACD line at -0.04 is marginally above its signal at -0.05, with a small positive histogram. That configuration hints at early momentum stabilization, where downside pressure is easing but not yet convincingly reversed.
Bollinger Bands on the daily chart span roughly from $0.37 to $0.50, with price hugging the midline. The fact that candles sit away from the lower band indicates that immediate selling aggression has waned. Yet the band width itself is moderate, aligning with the Average True Range near $0.03. Such parameters point to a regime of contained volatility, where trend traders may be frustrated by choppy follow-through, but option sellers might find more attractive setups.
Intraday Perspective and ADAUSDT token Momentum
While the higher timeframe remains heavy, the hourly chart tells a different story. Here, the asset trades slightly above its short EMAs: the 20-hour at $0.43, the 50-hour at $0.42 and the 200-hour also near $0.42. This stack reveals a short-term bullish bias, with dip buyers defending shallow pullbacks over the last sessions.
Meanwhile, the hourly RSI above 76 flags an overbought condition in the very near term. As a result, the latest push from intraday bulls looks more like a momentum spike than a fully confirmed trend. The hourly MACD is flat around zero with no meaningful histogram, consistent with a market that has rallied quickly and may now need to consolidate sideways or correct modestly before attempting further gains.
On the 15-minute chart, conditions appear more neutral. Price hovers exactly around the 20 and 50-period EMAs at $0.44, with the 200-period average only slightly below, and the RSI around 54. This configuration describes a short-horizon balance, where scalpers must be selective and avoid chasing breakouts that lack volume confirmation.
Key Levels and Market Reactions
In the current setup, the daily pivot at $0.44 is the immediate battlefield. Holding above this area keeps the door open for a test of the first resistance zone near $0.45, which also coincides with the 20-day EMA and the upper part of the hourly Bollinger structure. If buyers manage to close the day decisively above that cluster, it would signal a tentative shift in short-term control toward the bulls, potentially targeting the broader band ceiling around $0.50.
On the downside, the first meaningful support emerges around $0.43, where the daily S1 pivot sits just above the lower Bollinger mid-zone. A loss of this level on expanding volume would warn that the recent intraday strength is fading, reopening the path toward the lower band area around $0.37. Between these boundaries, traders should expect liquidity hunts and false breakouts as larger players probe both sides of the range.
For swing participants, the 50-day EMA near $0.54 and the 200-day closer to $0.67 remain the more strategic references. Only a sustained move back above the former would constitute genuine trend repair on the daily chart, while reclaiming the latter would mark a more profound regime change. Until then, the main scenario on the higher timeframe remains cautiously bearish, punctuated by aggressive but often short-lived relief rallies.
Open your Investing.com account
This section contains a sponsored affiliate link. We may earn a commission at no additional cost to you.
Future Scenarios and Investment Outlook
Overall, the base case for the coming weeks is a cautious consolidation within the current daily range, with a bearish tilt as long as price remains capped below the 20-day EMA. Short-term traders may look for mean-reversion opportunities around the pivot, selling intraday overextensions when hourly RSI spikes and buying dips closer to support, always with tight risk controls. Longer-term participants might prefer to wait for clearer trend confirmation, either via a sustained break above $0.50 and then $0.54, or, conversely, a decisive loss of $0.40 that would signal a deeper leg down.
In conclusion, the asset is not yet signaling a major bottom, but early stabilisation signs are visible beneath the surface. With fear still dominating sentiment and Bitcoin absorbing the lion’s share of flows, prudence is warranted. However, disciplined traders who respect levels, volatility and timeframes can still find opportunities in this evolving structure while keeping capital ready for a more convincing shift in the cycle.
This analysis is for informational purposes only and does not constitute financial advice.
Readers should conduct their own research before making investment decisions.
You May Also Like

Triple-A Integrates with Circle Payments Network to Support Cross-Border Stablecoin Settlement

Trump's airport move just laid bare a massive MAGA lie: columnist