

Trump crypto outlook: can TRUMPUSDT stabilize after the pullback?
 The recent pullback in Trump crypto has left traders wondering whether this correction is just a pause or the start of a deeper downtrend. With price sitting near a key daily pivot and sentiment in broader markets turning cautious, the next moves will likely be shaped by how buyers react around current support zones. In this piece we connect the higher-timeframe trend with short-term momentum to outline the most probable paths from here.
 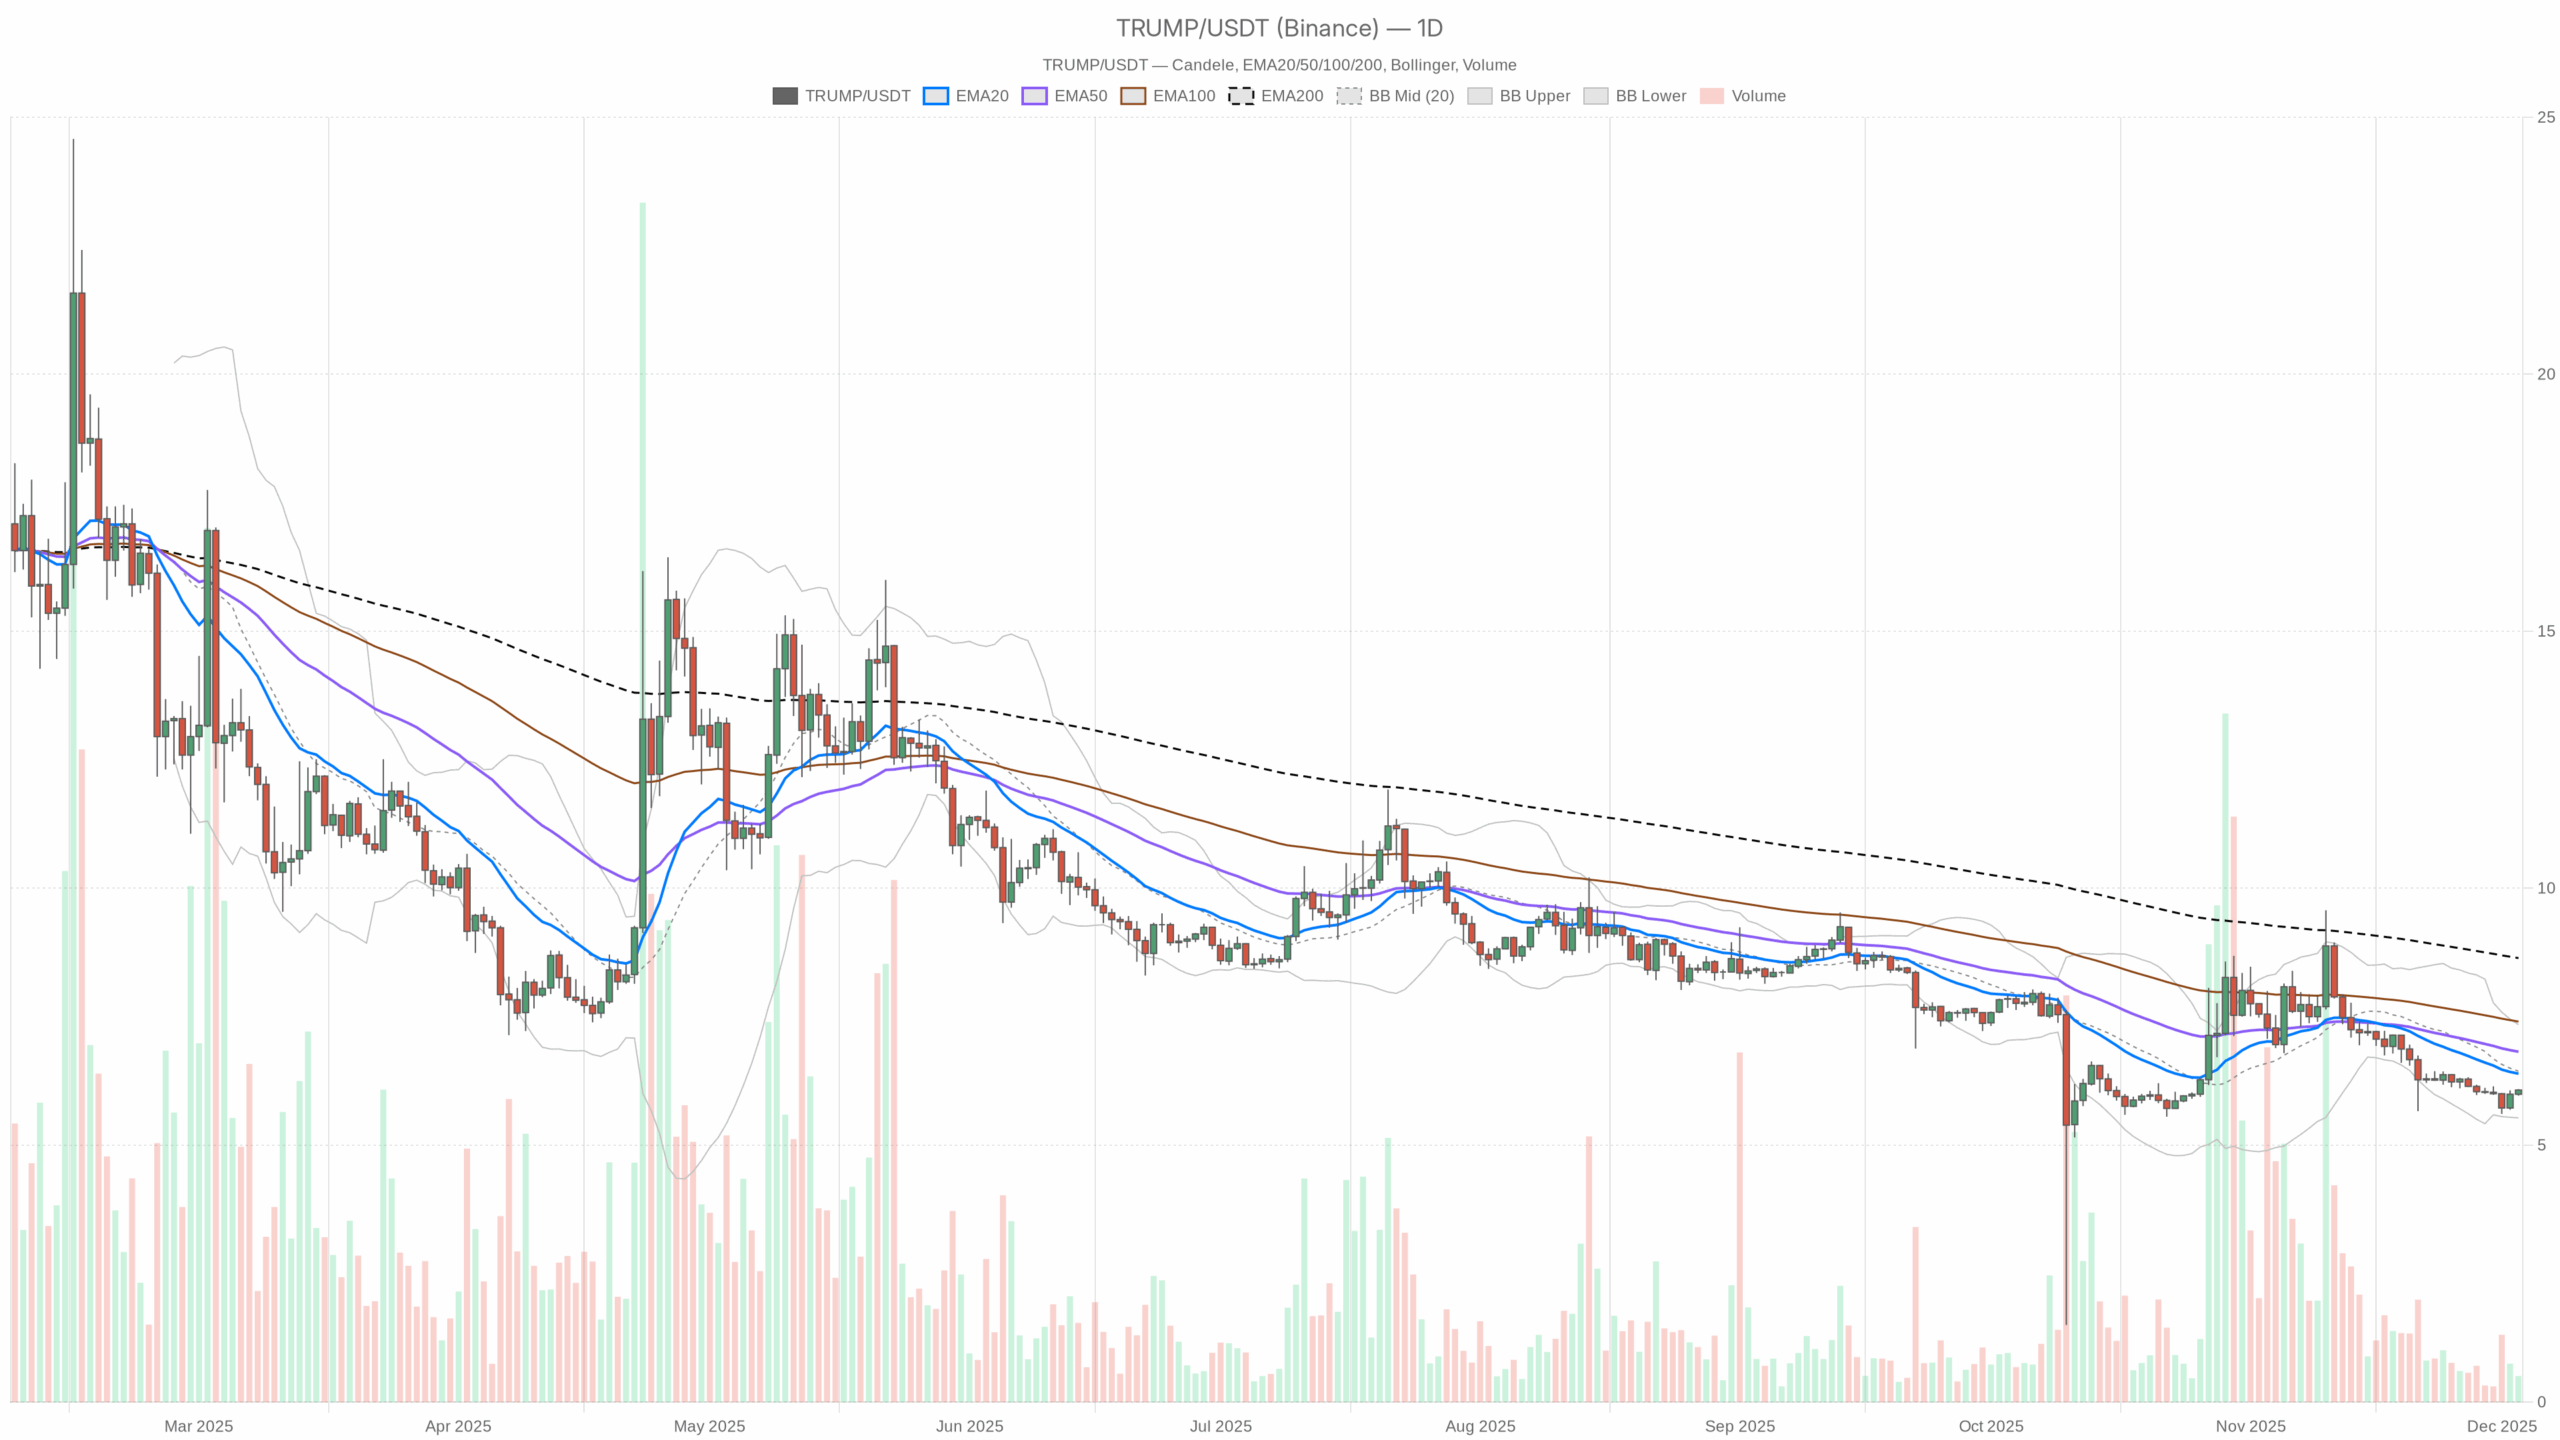 TRUMP/USDT — daily chart with candlesticks, EMA20/EMA50 and volume.
Summary
The daily chart shows a clear bearish market regime, with the asset trading below its 20, 50 and 200-day exponential moving averages. Momentum on the higher timeframe is weak, as the daily RSI sits in the low 40s, reflecting a controlled but persistent downside bias. MACD on the same timeframe is slightly negative and flat, pointing to momentum exhaustion after the latest decline rather than aggressive selling. Volatility on the daily chart remains moderate, with ATR well below 1 and price oscillating inside the Bollinger Band range. Meanwhile, intraday charts reveal a pocket of strength, as the hourly and 15-minute trends have turned constructive with rising EMAs and firm RSI values. Overall, the market appears to be in a corrective phase within a broader risk-on backdrop, with short-term traders probing the long side against nearby supports.
Trump crypto: Market Context and Direction
On the macro side, the crypto universe looks surprisingly resilient. Total market capitalization is around $3.23 trillion, with a robust 24-hour increase of roughly 6.9%, signaling renewed speculative interest. Bitcoin dominance sits near 57%, confirming that capital still gravitates first toward the benchmark asset before flowing further out the risk curve. For politically themed tokens, this kind of environment usually means liquidity is available, but flows are selective.
However, sentiment data tells a more cautious story. The Fear & Greed Index stands at 28, in the “Fear” zone, suggesting that many investors remain defensive despite the sharp rebound in overall capitalization. This combination of rising market cap and fearful sentiment creates a backdrop where contrarian accumulation can emerge, but only when charts show convincing stabilization. For this token, the dominant daily downtrend implies that any recovery is more likely to unfold as a grinding base rather than an explosive rally.
Technical Outlook: reading the overall setup
On the daily timeframe, price closes near 6.07, below the 20-day EMA at 6.39, the 50-day EMA at 6.82, and the long-term 200-day EMA at 8.64. This stacked configuration signals a well-established bearish bias, with lower highs likely defining the structure until at least the 20-day average is reclaimed. It tells us that medium-term participants still control the tape on the downside.
The daily RSI at 41.41 supports this view. It is below the neutral 50 line but not yet oversold, indicating weak trend strength rather than capitulation. Sellers are in control, though the absence of an oversold reading also means there is room for either a further leg down or a sideways digestion phase without an immediate need for a strong bounce.
Daily MACD is negative, with the line at -0.33 versus a signal at -0.29 and a shallow histogram of -0.04. This configuration reflects fading downside momentum; the prior sell wave has slowed, but has not transitioned into a clear bullish reversal. Typically, such a flat, slightly negative MACD precedes either a consolidation or a slow attempt to base if buyers begin to absorb supply.
Bollinger Bands on the daily chart show the midline near 6.44, the upper band around 7.35, and the lower band near 5.53. With price sitting between the mid and lower bands, the asset trades in the lower half of its recent volatility envelope, consistent with a corrective environment. Because the bands are not dramatically expanding, we do not yet see a volatility expansion that would mark a new, impulsive leg lower; instead, the market appears to be digesting prior losses.
ATR on the daily timeframe is modest at 0.3, equating to around 5% of price. This indicates controlled volatility, which usually favors range trading strategies over aggressive breakout chasing. In such conditions, traders often focus on well-defined support and resistance levels, expecting mean-reversion rather than runaway trends.
Intraday Perspective and TRUMPUSDT token Momentum
Intraday, the picture is more constructive. On the hourly chart, price at 6.07 trades above the 20 EMA at 6.00 and the 50 EMA at 5.93, and very close to the 200 EMA at 6.05. This alignment suggests an emerging short-term uptrend, as shorter averages have started to curl above longer ones. While the hourly regime is labeled neutral, the configuration hints that short-term buyers are testing the waters.
The hourly RSI at 68.53 leans into overbought territory, signaling that intraday momentum has flipped strongly upward after earlier weakness. As a result, there is a risk of short-term pullbacks as scalpers lock in profits, even if the broader intraday structure remains constructive. Hourly MACD is slightly positive and flat, indicating that this recent push higher is still tentative, with no clear trend runaway.
On the 15-minute chart, price stands comfortably above the 20, 50 and 200 EMAs, confirming a bullish intraday regime. RSI around 56.64 is healthy but not stretched, consistent with an intraday grind higher rather than a euphoric spike. Meanwhile, Bollinger Bands on this timeframe are tight, and ATR at 0.02 points to very low noise, making it easier for systematic traders to define tight risk levels around their entries.
Key Levels and Market Reactions
From a level perspective, the daily pivot sits almost exactly where price is trading, around 6.046.07. Holding above this zone would keep the door open for a short-term stabilization pattern, especially given the supportive intraday structure. Just above, the first resistance area emerges near 6.12 on the intraday pivots and extends toward the daily Bollinger midline around 6.44 as a more significant barrier. If price can close above that region, it would be the first meaningful hint of trend confirmation for a larger relief rally.
On the downside, immediate support appears around 5.996.00, where the first daily support level converges with the lower half of the Bollinger range. A sustained break below that pocket, especially on expanding ATR and widening bands, would warn that sellers are regaining dominance and that a move toward the lower band near 5.53 is on the table. In that scenario, the current intraday strength would prove to have been only a temporary bounce within a broader downtrend.
Open your Investing.com account
This section contains a sponsored affiliate link. We may earn a commission at no additional cost to you.
Future Scenarios and Investment Outlook
Overall, the main scenario remains bearish on the daily timeframe, with the asset still capped below all major EMAs and momentum only slowly stabilizing. Any sustainable recovery will likely require several sessions of sideways consolidation above the 6.00 area, followed by a decisive push through the 6.406.50 band. Until that happens, rallies are vulnerable to renewed selling from medium-term holders who are still underwater.
For active traders, the current setup favors a tactical approach: respecting the daily downtrend while acknowledging the intraday attempts to build a base. Short-term long positions may make sense near support when volatility stays contained, but with tight risk controls and modest expectations. Longer-term investors, meanwhile, might prefer to wait for clearer confirmation that the daily structure has turned, rather than trying to catch a falling knife in a still-fragile environment for Trump crypto.
This analysis is for informational purposes only and does not constitute financial advice.
Readers should conduct their own research before making investment decisions.
You May Also Like

The Protocol: Ethereum faces make-or-break moment as scaling, quantum and AI pressures mount

Adoption Leads Traders to Snorter Token

