

Despite a 35% fall, bitcoin remains the top performing major asset over the past five years
Welcome to the Canadian Crypto Observer. Financial journalist and author Aditya Nain offers perspective on market-moving headlines to help Canadian investors navigate the cryptocurrency market.
If you follow the crypto market, you’ve probably heard that cryptocurrency prices fell through the floor over recently. In October and November, Bitcoin (BTC) crashed from a peak of about $124,000 to a trough of about $80,000 (all figures in US dollar unless otherwise specified). That’s a worrying fall of about 35% in a matter of weeks, driven to a great extent by lower expectations of further rate cuts by the U.S. Federal Reserve (The Fed).
Nonetheless, BTC has recovered slightly and is trading at about $87,000 at the time of writing this column. Before we begin to pronounce the death of BTC and other cryptocurrencies, it would help to put things into perspective by looking at BTC’s performance as an asset over the past five years—especially in comparison with other popular assets.
The crypto crash in perspective
As the chart below shows, Bitcoin (BTC) has been in a cyclical bull market since November 2022, when it started rising off a low of about $16,400. Calculated at its recent high of about $124,000, that’s a gain of about 646% from trough to peak in almost three years—from November 2022 to October 2025.
Source: Google Finance as of Nov. 26, 2025
However, almost nobody is lucky enough to buy at the trough and sell at the peak. So, let’s look at BTC’s return for various periods over the past five years:
| Time period | BTC absolute return (%) | Annualized return / CAGR |
|---|---|---|
| 6 months | -21% | Not applicable |
| Year to date | -7% | Not applicable |
| 1 year | -8% | -8% |
| 3 year | 427% | 62.23% |
| 5 year | 389% | 37.34% |
Source: Data gathered from Google Finance as of Nov. 26, 2025
As the table above shows, BTC hasn’t done badly at all over the past three to five years, as long as you’ve held it through the usual ups and downs. If you’d asked an investor five years ago, in November 2022, if they’d be happy with a compounded annualized return of over 35% on their investment, most would have gladly taken it.
The best crypto platforms and apps
We’ve ranked the best crypto exchanges in Canada.
How does BTC’s return compare to stocks, gold and silver?
While BTC’s return looks good in the table above, how has it performed in comparison to other popular investment assets?
| BTC | Gold (GLD) | Silver (SLV) | S&P 500 (.INX) | Nasdaq Composite (.IXIC) | S&P/TSX Composite (OSPTX) | |
|---|---|---|---|---|---|---|
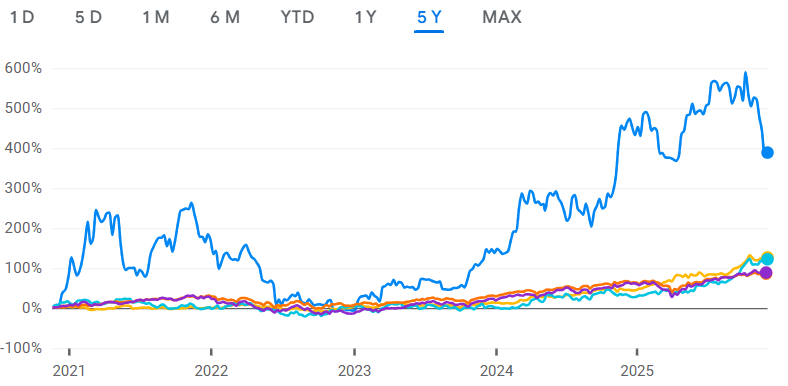
| 5 year return | 389% | 126% | 121% | 86% | 88% | 77% |
| 5 year CAGR | 37.34% | 17.11% | 17.26% | 13.21% | 13.22% | 12.18% |
Source: Google Finance as of Nov. 26, 2025
As is clear from the table above, despite BTC’s sharp and dramatic fall over the past six weeks, BTC remains the top performing asset from among those popular with investors. It’s even beaten the newsy and come-from-behind success story of 2025: silver.
On a simple 5-year percentage chart, here’s what the comparative performance of these assets looks like. BTC is the blue line at the top and the others are bunched together below.
Source: Google Finance as of Nov. 26,2025
Will BTC’s recent fall continue or are we already off the lows? There’s no way to tell for sure; however, if what we have right now is a cyclical bear market (as opposed to 35% correction within a bull market), I’d expect BTC to test its previous high of about $60,000 to $70,000 from 2021. This would be in line with BTC’s price performance in previous bear markets.
Is BTC’s recent fall unusual and worrying?
BTC may be a leader among various asset classes over the past five years, but is the October-November crash unusual in its 15-year history? As the table below shows, no it’s not.
Crashes of 30% or more from its peak are par for the course. In fact, as you’ll see in the table below, BTC has fallen 30% or more from all time highs eighteen times since 2010. This demonstrates that BTC has always bounced back to scale new all-time highs.
How long has it taken to scale new highs from these intermittent crashes? Between 8 to 1181 days! The range is broad and depends on whether we’ve seen the lows for this market cycle or not.
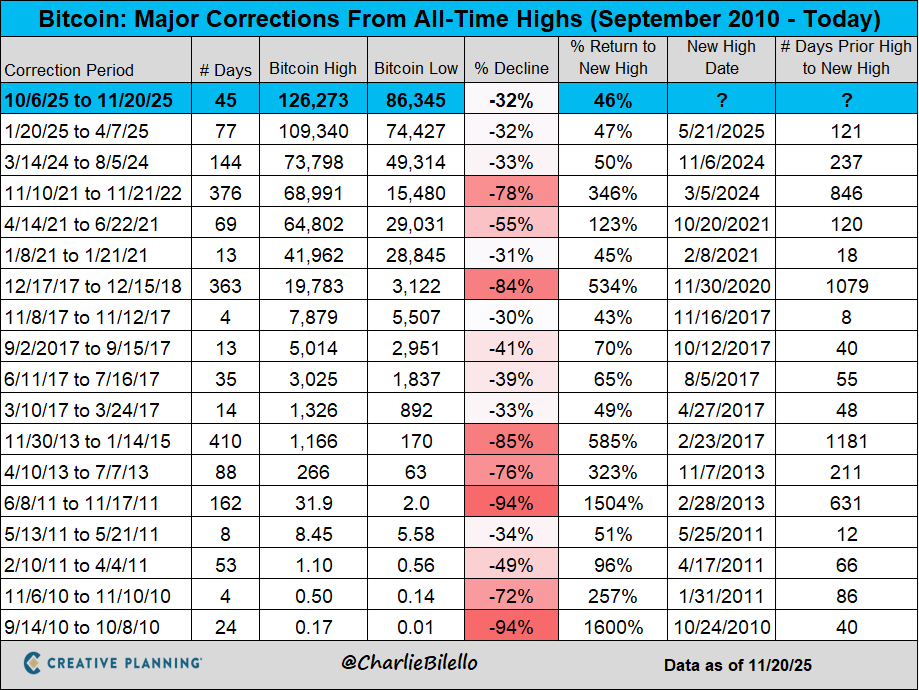 Source: https://x.com/charliebilello/status/1991579431958376451/photo/1
Could Canada see stablecoin regulation soon?
Taking a leaf from the U.S. Genius Act, Canada may regulate stablecoins soon-ish (possibly as soon as 2026). This would be positive for the crypto ecosystem.
In 2025, crypto prices got a boost from the U.S. GENIUS Act, which regulates U.S. dollar stablecoins—cryptocurrecies that are proxies for and tied to the U.S. dollar, such as Tether (USDT) and USDC.
The crypto market reacted positively to these developments in the U.S. because stablecoins comprise a large portion of the total crypto market. These coins allow investors to book profit from cryptocurrency investments by moving their money into a stable, U.S. dollar proxy without moving their money out of the crypto world.
Stablecoins are the cash of the crypto market. The popularity of U.S. dollar stablecoins has led to increased interest in stablecoins for other currencies, such as the Canadian dollar. But unregulated stablecoins are fraught with serious risks, thereby necessitating regulation and oversight. According to the Federal Budget released in November 2025, Canadian lawmakers will work towards drafting stablecoin regulation, with a key oversight role to be played by the Bank of Canada.
Crypto price swings are common
Cryptocurrencies including BTC, ETH, XRP, SOL, BNB, and others are speculative and highly volatile assets subject to significant price movements. Even stablecoins, which are seemingly “safe,” may be risky if not adequately backed by real-world assets.
Investing in bitcoin and other crypto coins carries significant market, technological, and regulatory risks. Invest in crypto only if it aligns with your broader investment goals, time horizon, and risk profile, and always stay vigilant about crypto scams.
Get free MoneySense financial tips, news & advice in your inbox.
Read more about crypto:
- Will bitcoin crash in 2025?
- Bitcoin tops USD$100,000 for the first time
- Price of bitcoin hits new high after Trump victory, and more crypto news
- How to protect your crypto from hacks
The post Despite a 35% fall, bitcoin remains the top performing major asset over the past five years appeared first on MoneySense.


You May Also Like

Iran’s drone threat persists despite US strikes, endangering Kuwait’s water facilities

Argentine Banks Test JPM Coin as Central Bank Reviews Crypto Ban: Report


