The post Pi Price Under Pressure—Is the $0.20 Support About to Fail? appeared first on Coinpedia Fintech News The Pi price action is flashing early warning signs as the token slips beneath a key trading range, threatening to deepen the correction that began after multiple rejections near $0.29. While the market remains in a consolidation phase, the structure is weakening, and Pi now sits at a make-or-break point that could define its December …The post Pi Price Under Pressure—Is the $0.20 Support About to Fail? appeared first on Coinpedia Fintech News The Pi price action is flashing early warning signs as the token slips beneath a key trading range, threatening to deepen the correction that began after multiple rejections near $0.29. While the market remains in a consolidation phase, the structure is weakening, and Pi now sits at a make-or-break point that could define its December …

Pi Price Under Pressure—Is the $0.20 Support About to Fail?

2025/12/05 22:21
3 min read
Pi Network News: Network Growth Outpaces Market Performance in Q4 2025

The post Pi Price Under Pressure—Is the $0.20 Support About to Fail? appeared first on Coinpedia Fintech News

The Pi price action is flashing early warning signs as the token slips beneath a key trading range, threatening to deepen the correction that began after multiple rejections near $0.29. While the market remains in a consolidation phase, the structure is weakening, and Pi now sits at a make-or-break point that could define its December trend.

Pi Faces a Critical Retest of the Rising Trendline

Pi is currently hovering directly above an ascending trendline that has supported the market since early October. But this support is no longer firm. Price has already slipped below the 50-day moving average, turning it into active resistance, and sellers are gradually overwhelming the structure with lower highs.

pi price

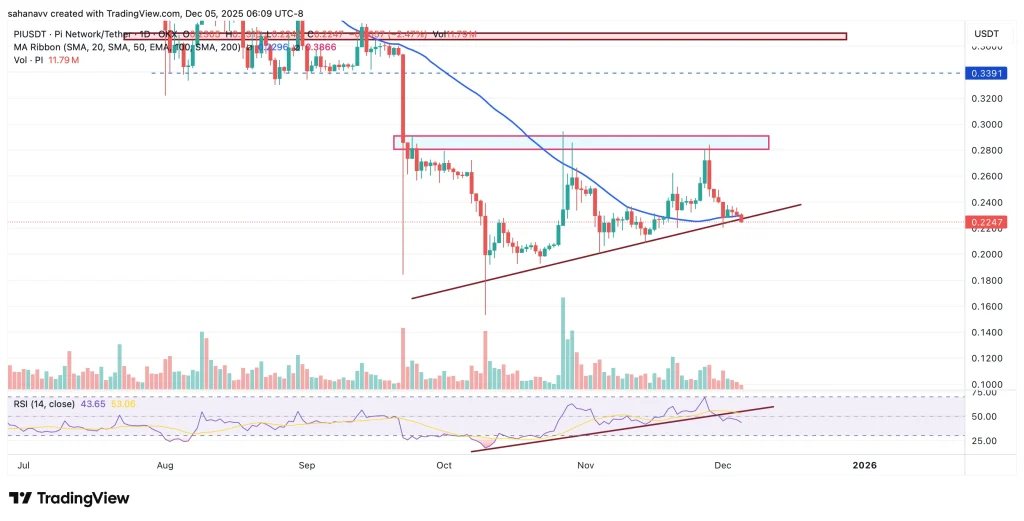
At the same time, the RSI — which had been forming higher lows—has now broken down from its own ascending support. This divergence between price stability and weakening momentum is typically an early indicator of trend exhaustion. Combined with declining volume, the market is showing signs of compression that often precedes a decisive move.

If Pi fails to hold its rising trendline at $0.223–$0.225, the breakdown could accelerate rapidly as liquidity below the level is thin. A slide toward $0.20 becomes the likely next step, and a deeper extension to $0.18 cannot be ruled out.

Loss of the Mid-Range Could Extend the Correction

The mid-range zone between $0.25 and $0.27 has been rejected three times in two months, confirming it as a strong supply region. Each rejection has produced a lower high, indicating that buyers are unable to regain momentum or reclaim lost market structure.

Now that Pi has lost its near-term trading range, the market is at risk of slipping into a broader descending structure. If the price closes firmly below $0.22, it would mark the first clean break of the multi-month uptrend—a shift that could turn the current pullback into a deeper correction phase.

However, bulls still have one final argument in their favor: the broader uptrend from the October lows remains intact as long as $0.20 holds. A rebound from the trendline, paired with increasing volume, could reset momentum and give Pi another attempt at $0.27.

Conclusion: December Hinges on $0.22 — Break or Bounce?

Pi price is approaching a decisive point. A sustained break below $0.22 would open the doors to a steeper correction toward $0.20–$0.18, while holding this zone could allow the price to rebound toward $0.25 and potentially retest $0.27.

Price targets:

  • Bearish: $0.20 → $0.18
  • Bullish: $0.25 → $0.27

At this stage, the chart is leaning bearish—but not fully broken yet. The next two daily closes will determine whether Pi stabilizes… or slips into a deeper downtrend.

Market Opportunity
Pi Network Logo
Pi Network Price(PI)
$0.14078
$0.14078$0.14078
-0.85%
USD
Pi Network (PI) Live Price Chart
Disclaimer: The articles reposted on this site are sourced from public platforms and are provided for informational purposes only. They do not necessarily reflect the views of MEXC. All rights remain with the original authors. If you believe any content infringes on third-party rights, please contact service@support.mexc.com for removal. MEXC makes no guarantees regarding the accuracy, completeness, or timeliness of the content and is not responsible for any actions taken based on the information provided. The content does not constitute financial, legal, or other professional advice, nor should it be considered a recommendation or endorsement by MEXC.

You May Also Like

Trading time: Tonight, the US GDP and the upcoming non-farm data will become the market focus. Institutions are bullish on BTC to $120,000 in the second quarter.

Trading time: Tonight, the US GDP and the upcoming non-farm data will become the market focus. Institutions are bullish on BTC to $120,000 in the second quarter.

Daily market key data review and trend analysis, produced by PANews.
Share
PANews2025/04/30 13:50
Polygon Tops RWA Rankings With $1.1B in Tokenized Assets

Polygon Tops RWA Rankings With $1.1B in Tokenized Assets

The post Polygon Tops RWA Rankings With $1.1B in Tokenized Assets appeared on BitcoinEthereumNews.com. Key Notes A new report from Dune and RWA.xyz highlights Polygon’s role in the growing RWA sector. Polygon PoS currently holds $1.13 billion in RWA Total Value Locked (TVL) across 269 assets. The network holds a 62% market share of tokenized global bonds, driven by European money market funds. The Polygon POL $0.25 24h volatility: 1.4% Market cap: $2.64 B Vol. 24h: $106.17 M network is securing a significant position in the rapidly growing tokenization space, now holding over $1.13 billion in total value locked (TVL) from Real World Assets (RWAs). This development comes as the network continues to evolve, recently deploying its major “Rio” upgrade on the Amoy testnet to enhance future scaling capabilities. This information comes from a new joint report on the state of the RWA market published on Sept. 17 by blockchain analytics firm Dune and data platform RWA.xyz. The focus on RWAs is intensifying across the industry, coinciding with events like the ongoing Real-World Asset Summit in New York. Sandeep Nailwal, CEO of the Polygon Foundation, highlighted the findings via a post on X, noting that the TVL is spread across 269 assets and 2,900 holders on the Polygon PoS chain. The Dune and https://t.co/W6WSFlHoQF report on RWA is out and it shows that RWA is happening on Polygon. Here are a few highlights: – Leading in Global Bonds: Polygon holds 62% share of tokenized global bonds (driven by Spiko’s euro MMF and Cashlink euro issues) – Spiko U.S.… — Sandeep | CEO, Polygon Foundation (※,※) (@sandeepnailwal) September 17, 2025 Key Trends From the 2025 RWA Report The joint publication, titled “RWA REPORT 2025,” offers a comprehensive look into the tokenized asset landscape, which it states has grown 224% since the start of 2024. The report identifies several key trends driving this expansion. According to…
Share
BitcoinEthereumNews2025/09/18 00:40
KAS Weekly Analysis Feb 10

KAS Weekly Analysis Feb 10

The post KAS Weekly Analysis Feb 10 appeared on BitcoinEthereumNews.com. KAS continues its downtrend with a weak performance, down 7.01% weekly; RSI at 38 signals
Share
BitcoinEthereumNews2026/02/10 11:36